Author

admin

Browsing

Silver has lagged behind gold’s record run, causing the gold-silver ratio to stretch near historic extremes.

With the gold price buoyed by central bank buying and silver increasingly tied to industrial demand, the disconnect between the two traditional safe-haven metals has widened.

But could the silver price finally be poised for a breakout?

During a recent silver-focused webinar, Sprott (TSX:SII,NYSE:SII) founder Eric Sprott, former Hecla Mining (NYSE:HL) CEO Phil Baker and technical analyst Michael Oliver joined host Simon Catt of Arlington Group to unpack what’s driving silver’s sluggish performance, and whether a reversal could be on the horizon.

The panelists explored silver’s shifting applications, the impact of macro forces like Bitcoin speculation and why some investors see today’s dynamics as a potential launchpad for silver’s next big move.

Understanding silver supply and demand

The silver price surged in 2024, rising from around US$22 per ounce at the start of the year to nearly US$35 by the end of October. Since then, silver has largely stayed in the US$30 to US$32 range, briefly breaking US$34 mark in March.

The metal has seen some support in 2025 due to instability in global financial markets caused by US President Donald Trump’s tariffs and the threat of reciprocal import fees against key trading partners.

These foreign policy shifts by the world’s largest economy have created uncertainty for investors who have been increasingly looking to traditional safe havens like silver and gold to de-risk their portfolios.

However, today’s tariff turmoil overshadows a fundamental shift in the silver market over the past several years, which has seen industrial demand growth start to outpace traditional investment demand.

The most notable demand increase has been due to the energy transition and silver’s use in solar panels.

While firms like Goldman Sachs (NYSE:GS) have predicted that industrial demand will wane over the next few years, Catt’s panelists presented different points of view. Sprott said there will be further demand from the electric vehicle (EV) market as producers look to solid-state batteries, which are not only safer, but also quicker to charge.

“I think (solid-state batteries) will bring back EVs to being viewed as economic,’ he said. ‘Plus the whole processing of solar panels and generating electricity more and more inexpensively over time, it’s just going to make the demand for silver continue to rise here when we already have a shortfall,” he told listeners.

Baker pointed out that solar currently makes up 29 percent of silver’s total 1.2 billion ounces of annual demand, and noted that if that were to disappear, it would have a massive impact on the silver market. However, he also said that even if there were a significant policy shift in the US, there would still be considerable demand for solar worldwide.

“Even in the US, the policy really is ‘all of the above’ — all forms of energy. So I’m not concerned about solar cells diminishing. Could they go flat? Yeah, that’s fine. Flat at 300 million ounces? That’s great demand for silver,” he added.

While most solar demand comes from China, the panelists also discussed India’s growing role in the sector. The country has recently been working to increase domestic production of solar panels.

“(Prime Minister Narendra) Modi made a policy decision a year ago to grow the solar industry in India. So in India, only about 10 percent of their demand for silver is used for industrial purposes. In China, it’s 90 percent, and so what you’re going to have in India is you’re going to see their solar panel growth skyrocket,” Baker said.

Of course, demand isn’t the only factor influencing the silver industry.

Supply constraints have helped push the market into a structural deficit over the past several years.

Silver is primarily a by-product metal in the production of copper, nickel, zinc and gold, which makes it highly dependent on dynamics in those markets. As Baker pointed out, silver isn’t a significant source of revenue.

“So even if the price of silver rises significantly, they’re not going to change their operations because it’s not going to matter for a big copper producer,” he explained. Unless there are dramatic production swings for those commodities, supply and demand are unlikely to come into balance in the near term.

Silver price poised to break out?

Over the past year, silver has tested US$35 twice. Using technical analysis, Oliver compared this to how the silver price tested resistance at the US$26 level three times before breaking through.

What he’s seeing in momentum indicators now is similar to what happened at that time. In the lead up, momentum was flat, but once silver hit US$26, momentum saw an immediate 10 percent gain.

‘It came back up a third time to US$26, watch out. It blew your head off,’ he said. ‘Okay, you go back to US$35 again, and the price says, ‘You better watch out, I’m at a triple top, and if I go to US$36, it’s a triple-top breakout.”

“The only issue is now which week punches up there to that 10 percent over level. I think — who knows, it might even be tomorrow, but I think soon we’ll get up there,” Oliver said.

Silver price, May 15, 2022, to May 16, 2025.

Oliver went on to examine the gold-silver ratio, which he said could be suggesting a breakout is overdue. Traditionally, the ratio falls between 40 and 80 to 1, but it’s now closer to 100 to 1.

“I bet both of these metrics will pretty much coincide in terms of upturn, meaning not only a net price upturn in silver, but a relative performance upturn in silver versus gold, and I think that’ll shock people more than anything … especially if all of a sudden silver wakes up in a shocking, rapid way,’ Oliver noted.

‘That’s going to surprise most investors. I think it’s about to happen, the technicals are ripe.’

Silver market still facing manipulation

Addressing manipulation, Sprott suggested silver has been manipulated for the last half century.

‘I look at silver as a market that’s been manipulated for 50 years. We have about eight to 12 major international banks who are short over 500 million ounces of silver on the COMEX, have always been short that product,’ he said.

‘They always make stabs at knocking it down, trying to cover, but the shorts go back up.’

However, Sprott said as the price has gone from the US$20 range to closer to US$35 it has become more difficult for these banks to maintain their positions. “The same thing is true in gold, but in gold we all know that in the last year, when it broke through US$2,000 (per ounce) for the fourth time, it was over for the commercial banks,” he noted.

He went on to discuss how trading on the COMEX seems contrary to what is going on in other markets, saying that when international markets are open, gold and silver prices trade higher, but when the COMEX opens, they tend to fall.

“If you just traded COMEX and you bought silver at the starting value, it’d be worth about 2 or 3 percent of what it started at, whereas if you bought it in non-COMEX hours, it would be worth 600 percent more,’ Sprott said.

In his view, the suppression is ‘obvious.’ However, he predicts that the gold-silver ratio will correct in the near future, and the silver price will start to outperform gold.

What’s the outlook for the silver price?

For his part, Sprott sees the silver price going much higher.

“I’m sure we’re going to be through US$50. It used to trade at 15 to 1 to the price of gold. At today’s price of gold, that would be over US$200. I have no reason to think we’re not going there,” he said.

Oliver had a similar price prediction.

“I think the first surge could get you well above US$50. I think you’d get up in the US$60s and US$70s before you even pause, and I think it could occur rapidly,” he said. Oliver also explained that cryptocurrencies like Bitcoin aren’t an alternative and appear more like a speculative bubble. Given the size of the US debt, Treasuries aren’t as attractive to investors, which is causing further compression in monetary metals markets.

Although Baker didn’t provide a price prediction, he did express support for a market driven by supply and demand fundamentals, saying that “this is a very, very unique time.”

Securities Disclosure: I, Dean Belder, hold no direct investment interest in any company mentioned in this article.

This post appeared first on investingnews.com

After spending most of 2025’s first quarter consolidating at the US$63 per pound level, spot U3O8 prices have been on an upswing, adding 13.62 percent between March 30 and May 14.

The uptick has been supported by improving utility demand, tariff clarity and resilient supply-demand fundamentals.

While broad market uncertainty added pressure for other commodities, uranium’s long term outlook prevented the energy fuel from suffering more declines at the start of the year’s second quarter.

“As other asset classes faltered, uranium held its ground, supported by its structural supply-demand story, inelastic demand and insulation from tariff-related disruptions,” Jacob White of Sprott (TSX:SII,NYSE:SII) wrote in a recent uranium report.

As tailwinds propelled the spot price higher uranium, uranium equities also caught an updraft.

“Physical uranium and uranium equities continue to outperform over longer periods,” said White, who is the firm’s exchange-traded fund product manager. “The strong five-year returns of physical uranium and uranium equities relative to broader commodity and equity benchmarks reinforce the metal’s role as a differentiated and strategic asset class.”

The list below provides an overview of the five largest uranium companies by market cap. All data was current as of May 15, 2025. Read on to learn about these top uranium stocks and their operations.

1. BHP (NYSE:BHP,ASX:BHP,LSE:BHP)

Market cap: US$128.63 billion

Mining major BHP owns and operates Australia’s Olympic Dam mine, considered one of the world’s largest uranium deposits. While the site is included in the company’s Copper South Australia operations portfolio and copper is the primary resource extracted, the mine also produces significant quantities of uranium, gold and silver.

In the operational review for its third fiscal quarter of 2025, released in mid-April, BHP reported a decrease in uranium production year-over-year. The company’s fiscal year-to-date uranium production totaled 2,180 metric tons, an 18 percent contraction from 2,674 metric tons in the first three quarters of fiscal 2024.

BHP is advancing its Olympic Dam expansion plan, which includes building a two-stage smelter, with a final decision due in 2026, and the US$5 billion Northern Water project, featuring a desalination plant and 600 kilometer pipeline.

The expansion targets a copper output of 650,000 metric tons annually by the mid-2030s, doubling its current production. While it was previously expected that BHP’s uranium output would expand at a similar rate, causing fear of oversupply and low prices, BHP announced in February that this would not be the case.

Uranium production is expected to rise marginally, by roughly 1 percent.

Additionally, if the company decides to expand the hydrometallurgical plant to process uranium in the future, growth will still be smaller than expected due to lower uranium concentrations in feedstock ore from newly integrated assets Carrapateena and Prominent Hill.

2. Cameco (NYSE:CCJ,TSX:CCO)

Market cap: US$23.2 billion

Uranium major Cameco holds significant stakes in key uranium operations within the Athabasca Basin of Saskatchewan, Canada, including a 54.55 percent interest in Cigar Lake, the world’s most productive uranium mine.

The company also owns 70 percent of the McArthur River mine and 83 percent of the Key Lake mill. Orano Canada is Cameco’s primary joint venture partner across these operations.

Cameco also holds a 40 percent interest in the Inkai joint venture in Kazakhstan, with the rest held by the state company Kazatomprom. The mine produces uranium using in-situ recovery.

Weak spot uranium prices between 2012 and 2020 weighed heavily on pure-play uranium producers. In 2018, Cameco placed the McArthur River and Key Lake operations on care and maintenance, reducing the company’s total annual uranium output from 23.8 million pounds in 2017 to 9.2 million pounds in 2018.

Improving market dynamics prompted the company to restart MacArthur Lake in 2022.

As a full nuclear fuel cycle provider, Cameco, in partnership with Brookfield Renewable Partners and Brookfield Asset Management, completed the purchase of Westinghouse Electric Company — a leading provider of nuclear power plant services and technologies — in November 2023.

In its Q1 update, Cameco reported steady operational and financial performance, with consolidated adjusted EBITDA of C$353 million and adjusted net earnings of C$70 million.

While uranium segment earnings declined due to timing of sales at its Inkai joint venture, average realized prices improved, supported by stronger fixed-price contracts and a favorable US dollar. For 2025, Cameco expects uranium production of 18 million pounds on a 100 percent basis at each of Cigar Lake and McArthur River/Key Lake.

After logistical issues at its Inkai joint venture in Kazakhstan weighed on production growth in 2024, Inkai suspended operations for about three weeks in January due to a directive from partner Kazatomprom. The revised 2025 production target is 8.3 million pounds on a 100 percent basis, with Cameco’s allocation at 3.7 million pounds. No deliveries from Inkai are expected until the second half of the year.

3. NexGen Energy (NYSE:NXE,TSX:NXE,ASX:NXG)

Market cap: US$3.18 billion

NexGen Energy, a company specializing in uranium exploration and development, is primarily focused on the Athabasca Basin. Its flagship project is the Rook I project, which includes the Arrow discovery.

The company also owns a 50.1 percent interest in exploration-stage company IsoEnergy (TSXV:ISO,OTCQX:ISENF).

In its Q1 results, NexGen reported a net loss of C$50.9 million, driven primarily by an impairment on its investment in IsoEnergy and ongoing exploration spending at its Rook I uranium project. Despite the loss, NexGen maintained a cash position of C$434.6 million, down from C$476.6 million at the end of 2024.

The largest component of the cash flow change was investing activities at C$34.3 million, mostly tied to C$28.1 million in exploration and evaluation expenses. The majority of this went toward technical work, permitting, and drilling at Rook I. NexGen also made a C$6.3 million follow-on investment in IsoEnergy.

Financing activity was limited, with C$557,000 raised from stock option exercises and C$6.8 million in restricted cash movements, resulting in a total cash outflow of C$41.9 million.

The company continues to hold a strategic uranium inventory of 2.7 million pounds of U3O8, valued at C$341 million. While NexGen does not currently generate production revenue, it remains well-capitalized to fund its development plans as it progresses Rook I toward potential construction and licensing milestones.

In late March NexGen reported its “best ever discovery phase intercept” at Rook I. As noted in a press release, drill hole RK-25-232 at the Patterson Corridor East zone intersected 3.9 meters of exceptionally high uranium readings within a larger 13.8 meter mineralized section starting at 452.2 meters depth.

4. Uranium Energy (NYSEAMERICAN:UEC)

Market cap: US$2.36 billion

Uranium Energy (UEC) has two production-ready in-situ recovery (ISR) uranium projects — its Christensen Ranch uranium operations in Wyoming and its Texas Hub and Spoke operations in South Texas — as well as two operational processing facilities. It plans to restart uranium production in Wyoming in August and resume South Texas operations in 2025.

The firm has built one of the largest US-warehoused uranium inventories, and in 2022 secured a US Department of Energy contract to supply 300,000 pounds of U3O8 as part of the country’s move to establish a domestic uranium reserve.

UEC also holds a wide portfolio of uranium projects in the US and Canada, some of which have major permits secured. In August 2022, UEC completed its acquisition of uranium company UEX. That same year, UEC also acquired both a portfolio of uranium exploration projects and the Roughrider uranium project from Rio Tinto (ASX:RIO,NYSE:RIO,LSE:RIO).

In January, UEC increased its stake in Anfield Energy (TSXV:AEC,OTCQB:ANLDF) by acquiring 107.1 million shares for approximately C$15 million, at C$0.14 per share. The deal boosts UEC’s ownership to about 17.8 percent.

A month later, the company announced that it had achieved a key milestone by successfully processing, drying and drumming uranium at its Irigaray central processing plant in Wyoming.

Uranium concentrate produced from the plant will be shipped to the ConverDyn conversion facility in Illinois.

In March, UEC released results for the quarter ended on January 31, highlighting that additional wellfields at Christensen Ranch were on track to begin production in the coming weeks. It also finalized the acquisition of Rio Tinto’s Sweetwater plant, adding 4.1 million pounds per year of licensed capacity and establishing its third ISR hub-and-spoke platform.

Financially, UEC reported Q2 revenue of US$49.8 million from selling 600,000 pounds of U3O8 at US$82.92 per pound, generating US$18.2 million in gross profit. The company holds 1.36 million pounds in uranium inventory valued at US$97.3 million, with an additional 300,000 pounds to be acquired at US$37.05 per pound this December.

In May, UEC signed a memorandum of understanding with Radiant Industries to collaborate on strengthening the US nuclear energy value chain. As part of the agreement, UEC will supply domestically sourced uranium to Radiant. The partnership supports Radiant’s development of the Kaleidos portable nuclear microreactor, which is planned to be mass produced, aligning with growing national interest in small modular reactors and energy security.

5. Denison Mines (NYSEAMERICAN:DNN,TSX:DML)

Market cap: US$1.33 billion

Denison Mines is focused on uranium mining in Saskatchewan’s Athabasca Basin. holding a 95 percent interest in the Wheeler River uranium project, which hosts the Phoenix and Gryphon deposits.

The company has significant landholdings in the basin through both operating and non-operating joint venture interests with uranium majors such as Orano and Cameco. This includes a 22.5 percent interest in Orano’s McLean Lake mill and mine, the latter of which is expected to re-enter production in 2025.

In 2023, Denison completed a feasibility study for Phoenix, which hosts proven and probable reserves of 56.7 million pounds of uranium. The company is planning to use ISR for Phoenix and is targeting first production for 2027 or 2028. Denison also updated a 2018 prefeasibility study for the Gryphon deposit as an underground mine.

According to the company, both deposits have low-cost production potential.

In February, Denison announced that the Canadian Nuclear Safety Commission has scheduled public hearings for the Phoenix ISR project, which will take place in two parts, one in October and one in December.

The hearings are the final step in the federal approval process for the project’s environmental assessment and license to construct and prepare a uranium mine and mill.

On May 12, Denison released its results for the first quarter, noting that Phoenix had reached 75 percent completion for total engineering. If it receives approval later this year, Denison expects to begin construction for the Phoenix ISR operation in early 2026 and achieve production in 2028.

Meanwhile, site prep resumed at the McClean North deposit, which will be mined using the joint venture’s proprietary SABRE mining method. Operations are on track to begin mid-year.

FAQs for uranium investing

What is uranium?

First discovered in 1789 by German chemist Martin Klaproth, uranium is a heavy metal that is as common in the Earth’s crust as tin, tungsten and molybdenum. Named after the planet Uranus, which was also discovered around the same time, uranium has been an important source of global energy for more than six decades.

What country has the most uranium?

Australia and Kazakhstan lead the world in both terms of uranium reserves and uranium production. Australia takes first prize for the world’s largest uranium reserves, representing 28 percent globally at 1,684,100 MT of U3O8. However, the Oceanic country ranks fourth in global uranium production, putting out 4,087 MT of U3O8 in 2022.

For its part, Kazakhstan controls 13 percent of global uranium reserves and leads the world in uranium production with 2022 output of 21,227 MT. Last year, Canada passed Namibia to become the second largest uranium producer, putting out 7,351 MT of U3O8 in 2022 compared to Namibia’s 5,613 MT. The countries hold 10 percent and 8 percent of global reserves respectively.

Securities Disclosure: I, Georgia Williams, hold no direct investment interest in any company mentioned in this article.

This post appeared first on investingnews.com

Strategy Executive Chairman Michael Saylor has drawn attention to the impressive 121% rally in the Metaplanet stock, following the Japanese firm’s aggressive Bitcoin buying. Today, the stock surged another 15% on the Tokyo Stock Exchange, closing the day another 100 points higher at 783 JPY. The Japanese firm has even outpaced Strategy’s MSTR performance since the beginning of 2025. Metaplanet Stock Rally Impresses Michael Saylor In a message on the X platform, Strategy executive chairman Michael Saylor posted the chart of Metaplanet stock, asking company CEO Simon Gerovich about the stellar performance and 120% gains over the past month. What’s up with Metaplanet, Simon @Gerovich? pic.twitter.com/1kunjxt3Ye — Michael Saylor (@saylor) May 20, 2025 Responding to it, Gerovich wrote: “Bitcoin is the key.” Another major reason behind this stock rally this week is the impressive Q1 results reported by the Japanese firm. The operating revenue for Metaplanet has shot up to… Read More at Coingape.com

The post “What’s Up With Metaplanet”? Michael Saylor Praises Impressive 121% Stock Rally appeared first on CoinGape.

Ripple (XRP) surged above $3 in January 2025, marking the first time it broke out past that level since 2017. This surge has drawn speculation among investors on whether XRP price can surge 5x in 2025 and attain a double digit price. At its current price of $2.35, a 5x rally will push XRP to $11.75, and four powerful factors within the Ripple ecosystem suggest that this target is attainable. Why XRP Could Rally 5x in 2025 Regulatory Clarity from the GENIUS Act The US Senate has advanced the GENIUS stablecoin act, and once the Senators debate and vote on it, this act will bode well for US-native stablecoins such as Ripple’s RLUSD. If RLUSD attains around 1% USDT’s market cap of $150 billion market cap, RLUSD’s valuation will rise from the current $312M to $1.5 billion by year’s end. This represents a nearly 5 times growth. Assuming that XRP… Read More at Coingape.com

The post 4 Powerful Factors That Could Boost XRP Price 5x in 2025 appeared first on CoinGape.

DigiAsia’s stock soared by 91% on May 19, closing at 36 cents. This happened after the company announced it would start holding Bitcoin as part of its treasury plan. The fintech firm, based in Indonesia, said it plans to raise $100 million to begin building its BTC reserves, joining a growing list of public companies turning to digital assets. The Jakarta-based company, which trades on the Nasdaq under the symbol FAAS, said its board has approved the creation of a Bitcoin treasury. It also committed to putting up to 50% of its future net profits toward buying Bitcoin.  DigiAsia Embraces Bitcoin as a New Reserve Asset In its statement, DigiAsia announced its plans to diversify ways to earn returns on its Bitcoin, such as lending, staking, or offering crypto-linked financial products. The company is in talks with licensed partners to help manage these digital assets securely. This move is in… Read More at Coingape.com

The post DigiAsia Stock Jumps 90% After Announcing Bitcoin Buying Plan appeared first on CoinGape.

With Bitcoin (BTC) price approaching its all-time high of $110,000, the choppy price action has liquidated $845 million in just two days. Spot ETF flows and institutional accumulation show investors are optimistic about BTC’s future and that an ATH retest is possible. However, a closer look at technicals suggests traders must exercise caution in the short term. BTC Price & Investors Remain Bullish Despite $845M in Liquidations The May 18 and 19 price action saw BTC price climb to $106.6k, drop to $102k, and revisit a four-month high of $107.1k. As a result of this whipsaw, the cryptocurrency market witnessed a liquidation of $845 million, according to CoinGlass data. Despite this culling, the Open Interest (OI) remained high at around 199.72k BTC. A look at the OI growth relative to Bitcoin’s price since the second quarter shows how bullish traders are. Bitcoin Price vs. Open Interest, Source: Velo Another driver… Read More at Coingape.com

The post BTC Price’s $107K Push Sparks $845M Liquidations – ATH or Crash Next? appeared first on CoinGape.

Binance is fighting a $1.76 billion lawsuit from the FTX estate, seeking a Delaware court to dismiss it . The case centres on a 2021 equity buyback deal between the two crypto exchanges, which took place over a year before FTX collapsed. Binance argues the lawsuit is “legally flawed” and should be dismissed. FTX says it used customer funds without permission to repurchase Binance’s stake. But Binance’s lawyers claim the accusation is based on weak assumptions and lacks evidence. Binance Accuses FTX of Avoiding Accountability In its court filing, Binance argued that FTX is trying to shift blame away from its founder, Sam Bankman-Fried, who is serving a 25-year prison sentence for fraud. Binance claims the lawsuit ignores the real reason for FTX’s failure, calling it “one of the biggest corporate frauds in history.” The company also said it had no role in FTX’s collapse and emphasized that none of… Read More at Coingape.com

The post Binance Lawyers Ask Court to Throw Out $1.76B FTX Lawsuit Case appeared first on CoinGape.

Sector Rotation Shakeup: Industrials Take the Lead

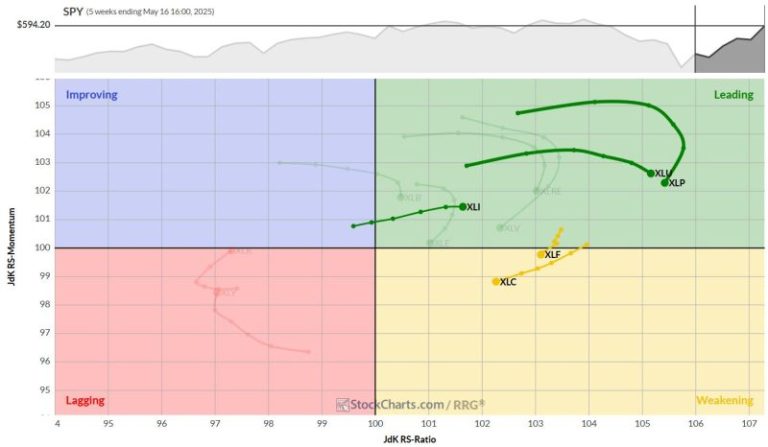
Another week of significant movement in the sector landscape has reshaped the playing field. The Relative Rotation Graph (RRG) paints a picture of shifting dynamics, with some surprising developments in sector leadership. Let’s dive into the details and see what’s happening under the hood.

  1. (6) Industrials – (XLI)*
  2. (4) Financials – (XLF)*
  3. (1) Utilities – (XLU)*
  4. (2) Communication Services – (XLC)*
  5. (3) Consumer Staples – (XLP)*
  6. (8) Technology – (XLK)*
  7. (5) Real-Estate – (XLRE)*
  8. (9) Materials – (XLB)*
  9. (11) Energy – (XLE)*
  10. (10) Consumer Discretionary – (XLY)
  11. (7) Healthcare – (XLV)*

Weekly RRG

On the weekly RRG, Utilities and Consumer Staples maintain their high positions on the RS-Ratio scale. However, there are signs of waning momentum. Staples has rolled over within the leading quadrant and is now showing a negative heading. Utilities, while still strong, are losing some of their relative momentum.

Financials and Communication Services are hanging on in the weakening quadrant, but their tails are relatively short — indicating potential for a quick turnaround.

The show’s star, Industrials, has made a beeline for the leading quadrant, climbing on the RS-Ratio scale while maintaining a positive RRG heading.

Daily RRG

Switching to the daily RRG, we get a more granular view. Utilities, Staples, and Financials are found in the lagging quadrant, but Staples and Utilities are showing signs of life, turning back up towards the improving quadrant.

Financials, meanwhile, are hugging the benchmark.

The daily chart confirms Industrials’ strength, mirroring its weekly performance.

Communication Services, however, is showing some worrying signs — it’s dropped into the weakening quadrant on the daily RRG, confirming its vulnerable position on the weekly chart.

Industrials

XLI flexes its muscles, pushing against overhead resistance around the $144 mark.

A break above this level could trigger a further acceleration in price.

The relative strength line has already broken out of its consolidation pattern, propelling both RRG lines above 100 and driving the XLI tail deeper into the leading quadrant.

Financials

The financial sector continues its upward trajectory, trading above its previous high and closing in on the all-time high of around $53.

Like Industrials, a break above this resistance could spark a new leg up.

The RS line is moving sideways within its rising channel, causing the RRG lines to flatten—something to watch.

Utilities

XLU has finally broken through its overhead resistance, approaching its all-time high around $83.

After months of pushing against the $80 level, this breakout is a clear sign of strength.

The RS line is still grappling with its own resistance, but the RS-Ratio line continues its gradual ascent.

Communication Services

While XLC is moving higher on the price chart, its relative strength is lagging.

The sideways movement in the RS line is causing both RRG lines to move lower, with the RS-Momentum line already below 100.

This sector is rapidly approaching the lagging quadrant on the daily RRG—definitely one to watch for potential risks.

Consumer Staples

XLP is approaching the upper boundary of its trading range ($83-$85), where it is running into resistance. The inability to push higher while the market is moving up is causing relative strength to falter.

The recent strength has pushed both RRG lines well above 100, but the current loss of relative strength is now causing the RRG-Lines to roll over.

The tail is still comfortably within the leading quadrant, but this loss of momentum could signal a potential setback.

Portfolio Performance

The model portfolio’s defensive positioning has led to some underperformance relative to SPY, with the gap now just under 6%.

However, the model is sticking to its guns, maintaining a defensive stance with Staples and Utilities firmly in the top five.

It’s worth noting that Healthcare has now definitively dropped out of the top ranks. Nevertheless, with Staples and Utilities holding firm, and Technology and Consumer Discretionary still in the bottom half, the overall positioning remains cautious.

These are the periods when patience is key. We need to let the model do its work and wait for new, meaningful relative trends to emerge. It’s not always comfortable to endure underperformance, but it’s often necessary to capture longer-term outperformance.

#StayAlert, –Julius