Author

admin

Browsing

The crypto investment products have witnessed $3.3 billion in inflow this week, and a massive XRP inflow crash. The popular cryptocurrency has faced a $37.2M outflow, whereas its competitors have taken the lead in inflows, raising suspicion on some underlying issues. Meanwhile, the XRP price also struggled on the chart. So, let’s discuss the key reasons behind this downfall. XRP Inflows Crash While SOL, ADA Gains Momentum According to the CoinShares report, the crypto investment products are witnessing high inflows, $3.3 billion weekly and $10.8 billion over 6 weeks. In the period, the AUM event hit $187.5 billion briefly before declining, led by the Bitcoin price rally to an ATH. However, XRP inflows lost momentum this week, witnessing a $37.2 million crash, the worst weekly performance. Interestingly, this change wasn’t new, as the XRP downtrend has been going on for nearly a month, with $28.6M outflows to date. As a… Read More at Coingape.com

The post Top 3 Reasons Why XRP Inflows Crash to $37 Million appeared first on CoinGape.

Michael Saylor’s Strategy, previously known as MicroStrategy, made another BTC purchase between May 19 and 25, bringing its total holdings to 580,250 BTC. This comes amid plans to raise $2.1 billion to buy more BTC. Meanwhile, the MSTR stock price is in the red and has failed to rally despite the announcement of this most recent Bitcoin purchase. Strategy Purchases 4,020 BTC for $427.1 Million In a press release, the company announced that it has purchased 4,020 BTC for $427.1 million at an average cost of $106,237 per Bitcoin. It has also achieved a BTC yield of 16.8% year-to-date (YTD). The firm now holds 580,250 BTC, which it acquired for $40.16 billion at an average price of $69,979 per Bitcoin. It remains the public company with the largest Bitcoin holdings, well ahead of the second-placed MARA Holdings. This marks the company’s seventh consecutive Bitcoin purchase in a period that dates… Read More at Coingape.com

The post Breaking: Strategy Acquires 4,020 BTC For $427M; MSTR Stock Price Down 7% appeared first on CoinGape.

SUI Price is 3.91% up in 24 hours after SUI’s top DEX Cetus announced the freezing of $162 million of the $220 million that hackers drained on Thursday’s smart contract exploit. As per a Q&A update by Cetus, the frozen amount was held within SUI while the remaining $60 million is held in ETH outside the ecosystem.  To recover 100% of the funds, the team said a concerted effort was already underway between them, the SUI Foundation and various other entities. What’s Happening with SUI? On May 24, SUI released an update on X explaining how the funds were frozen to calm concerns of the network’s centralization risk. “Each validator has a configuration file that allows it to ignore transactions from a specific address. Adding addresses to this file is at the discretion of each individual validator, and can be reversed at any time,” Said the tweet. For this reason,… Read More at Coingape.com

The post Analyst Reveals Timeline for $20 SUI appeared first on CoinGape.

With Bitcoin hitting $111K ATH, investors are reminiscing about how much BTC has grown in the past decade. If Pi Coin were to achieve a similar growth, it would be massive. Let’s explore how many Pi tokens an investor needs to hold if the Pi Coin price today is similar to Bitcoin back in 2010. How much would Pi Network price need to rally for a holder to retire with $1M? At press time, Pi Coin is trading at $0.7846 following a 20.23% rally over the past month. According to historical data, the highest Bitcoin price in 2010 was $0.35. A holder who accumulated 10,000 BTC at that price reached $1 million in April 2013 when the cryptocurrency reached $100. Is 10,000 PI Enough to Retire with $1 Million? If Pi Coin today is Bitcoin in 2010, would you still need 10,000 PI in your portfolio to retire with $1… Read More at Coingape.com

The post If Pi Coin Today is Bitcoin in 2010, How Much Should You Hold to Retire with $1M? appeared first on CoinGape.

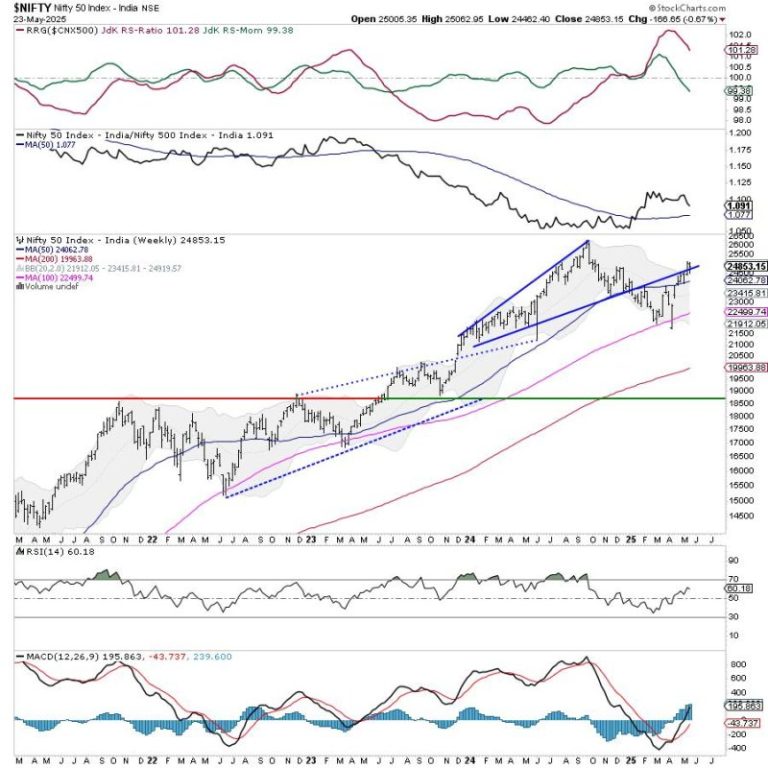
After a very strong move in the week before this one, the markets chose to take a breather. They moved in a wide range but ended the week on a mildly negative note after rebounding from their low point of the week. While defending the key levels, the markets largely chose to stay within a defined range. The trading range remained reasonably wide; the Nifty oscillated in a 600.55-point range over the past five sessions. The volatility inched modestly higher; the India Vix rose 4.40% to 17.28 on a weekly basis. While keeping its head above crucial levels, the headline index closed with a net weekly loss of 166.65 points (-0.67).

The coming week will be an expiry week; we will have monthly derivatives expiry playing out as well. Going by the options data, the Nifty has created a trading range between 25100 and 24500 levels. The markets are likely to consolidate in this 600-point trading range. A directional bias would emerge only if the Nifty takes out 25100 on the upside convincingly or ends up violating the 24500 level. While the underlying trend stays intact, the markets are unlikely to develop any sustainable trend so long as they do not move past the 25100 level. While the markets stay in the defined range, it would be prudent to vigilantly guard profits at higher levels and rotate sectors effectively to remain invested in the relatively stronger pockets.

The coming week is likely to see the levels of 25000 and 25175 acting as potential resistance points. The supports come in lower at 24600 and 24450 levels.

The weekly RSI is at 60.14; it stays neutral and does not show any divergence against the price. The weekly MACD is bullish and stays above its signal line.

The pattern analysis shows that the Nifty has formed a trading range between 25100 on the higher side and 24500 on the lower side. This means that a directional bias would emerge only if Nifty moves past 25100 convincingly or violates the 24500 level. Until either of these two things happens, we will see the Nifty consolidating in this defined range. The Nifty has so far defended the pattern support level that also exists in the 24400-24500 zone.

Overall, the markets continue to remain in a challenging environment and face strong resistance near the 25100 level. So long as the Nifty stays below this level, it stays prone to corrective spikes, which may also keep volatility at slightly elevated levels as well. Given the current technical structure, it would be imperative that not only the sectors be rotated properly to stay invested in relatively stronger pockets, but all existing gains must also be vigilantly guarded at current levels by the investors. While continuing to keep leveraged exposures at modest levels, a cautious outlook is advised for the coming week.


Sector Analysis for the coming week

In our look at Relative Rotation Graphs®, we compared various sectors against the CNX500 (NIFTY 500 Index), representing over 95% of the free-float market cap of all the listed stocks. 

Relative Rotation Graphs (RRG) show that while the Nifty Consumption, PSU Bank, Infrastructure, Banknifty, FMCG, and Commodities indices are in the leading quadrant, all are showing a distinct slowdown in their relative momentum against the broader Nifty 500 Index. While these groups are likely to show resilience and may relatively outperform, except for the Consumption Index, they are giving up in favor of other sectors that are showing renewed relative strength.

The Nifty Financial Services Index has rolled inside the weakening quadrant. The Nifty Metal and Services Sector Indices are also inside the weakening quadrant.

While the Nifty Pharma Index continues to languish inside the lagging quadrant, the IT Index, which is also inside the lagging quadrant, is showing sharp improvement in its relative momentum against the broader markets.

The Nifty Realty, Auto, Midcap 100, and Energy Sector Indices are inside the improving quadrant. These groups are expected to continue bettering their relative performance against the broader markets.


Important Note: RRG charts show the relative strength and momentum of a group of stocks. In the above Chart, they show relative performance against NIFTY500 Index (Broader Markets) and should not be used directly as buy or sell signals.  


Milan Vaishnav, CMT, MSTA

Consulting Technical Analyst

www.EquityResearch.asia | www.ChartWizard.ae

The author of ‘Rich Dad Poor Dad’ Robert Kiyosaki, has broken his silence on the real reason he invests in Bitcoin (BTC) as an asset. In a post on X titled ‘ARE YOU BREAKING the LAWS?,’ he spoke directly to those violating the core principles about money, highlighting why they are poor. While not uncommon, this latest post justifies his adoption of Bitcoin as a store of value. Robert Kiyosaki Validates Bitcoin as Investment to Save According to the financial expert, the poor violate two important laws of money: Gresham’s Law and Metcalf’s Law. Gresham’s law states that when bad money enters a system, good money goes into hiding. He slammed those who save fake money while shunning real money. He named his three favorites, which include Gold, Silver, and Bitcoin. ARE YOU BREAKING the LAWS? Most poor people are poor…. because they break the 2 most important laws of… Read More at Coingape.com

The post Robert Kiyosaki Reveals Real Reason Why He Invests In Bitcoin appeared first on CoinGape.

Pro-XRP lawyer John Deaton has tapped two Ripple executives to join an exclusive list of crypto all-time greats. The XRP supporter argues that Ripple’s co-founder, Jed McCaleb, and company CTO, David Schwartz, can sit alongside Satoshi Nakamoto on Crypto Mount Rushmore. Ripple Executives To Rank Alongside Satoshi and Buterin On Crypto Mount Rushmore In an X post, John Deaton unveiled his picks for a Crypto Mount Rushmore, placing anonymous Bitcoin creator Satoshi Nakamoto at the top. Beneath Satoshi’s blank face, the pro XRP lawyer reels out potential candidates to make the cut for a Crypto Mount Rushmore based on their contributions to the cryptoverse. Deaton taps Ethereum co-founder Vitalik Buterin to make the exclusive list for introducing smart contracts and decentralized applications. Deaton says Buterin’s inclusion into the list is a “no-brainer” given his pioneering status in the ecosystem. The lawyer tips Ripple co-founder Jed McCaleb to make the cut,… Read More at Coingape.com

The post XRP Lawyer Reveals Crypto Mount Rushmore List: Ripple Executives Join Satoshi Nakamoto appeared first on CoinGape.

Dogecoin charts show formation of bullish “Adam and Eve” double bottom pattern, a market structure that precedes a major breakout. This pattern emerged on the weekly chart and follows a notable DOGE price gain of 6.69% over the past seven days. The on chain metrics and other factors support this breakout.  Is A Dogecoin Breakout to $1 Next? Dogecoin price targets an 88.97% breakout toward $1.08 as it completes a rare Adam and Eve double bottom on the weekly chart. The meme coin is consolidating near $0.228, following a rounded Eve bottom from mid-2022 to late 2024, and a sharp retracement and spike forming the v-shaped Adam structure in early 2025. The Adam and Eve pattern is a bottoming structure that typically marks the end of a prolonged downtrend. It comprises two distinct troughs — a rounded “Eve” followed by a steep “Adam”, which usually signals a shift in momentum… Read More at Coingape.com

The post Dogecoin Price Ready for A Breakout As Charts Print Rare Bullish Signal appeared first on CoinGape.

High-stakes crypto trader James Wynn has taken his riskiest bet yet – a $1.2 billion leveraged Bitcoin long position on Hyperliquid. However, CrediBULL Crypto says James Wynn’s Hyperliquid BTC long position runs a high risk of liquidation. CrediBULL Crypto Is Pitching His Tent Against James Wynn Pseudonymous cryptocurrency investor James Wynn has sent the cryptoverse buzzing after opening a Hyperliquid BTC long position. Per on-chain data, James Wynn’s new leveraged long position is valued at $1.25 billion and comprises 11,407 BTC. The high-stakes investor has previously gone long on Bitcoin before taking partial profits. James Wynn’s previous  $1.1 billion BTC long threatened to send the HYPE token price to $100. Now, Wynn has reopened the position while raising the stakes, but pundits are predicting a grim outlook for the trader. Wynn’s Hyperliquid BTC long position is set at $105K, and with Bitcoin price trading at $108K, CrediBULL Crypto says Wynn… Read More at Coingape.com

The post Crypto Expert Bets Against James Wynn’s $1.2B Hyperliquid BTC Long Position appeared first on CoinGape.

Market expert SIR CHARTIST has dropped an in-depth analysis of the MSTR stock price action. In his analysis, he explained why the stock is primed for a crash to as low as $350. However, he remarked that the stock will eventually witness another 100% rally, which could send its price to $700. MSTR Stock Could Drop To $350 Before Surge To $700 In an X post, SIR CHARTIST indicated that the stock could drop to $350 before the surge to $700. He stated that he is looking to see more panic to the $350 level, followed by a decrease in selling volume and an increase in volume associated with green candles. He noted that right now, the MSTR trade is not the same as it has been since April. SIR CHARTIST explained that the probability of it being a successful day trade to the long has diminished, suggesting that market… Read More at Coingape.com

The post MSTR Stock Could Crash To $350 Before Rally To $700, Says Expert appeared first on CoinGape.