Author

admin

Browsing

Statistics Canada released April’s gross domestic product (GDP) numbers on Friday (June 27). The data showed a slowing in the Canadian economy with a 0.1 percent monthly decline after it increased 0.2 percent in March as businesses attempted to get ahead of US tariff deadlines.

In April, the shift in US trade policy led to significant declines in the manufacturing sector, which saw its largest drop in four years at 1.9 percent. Durable goods manufacturing declined for the first time in four months, dropping 2.2 percent d. The most heavily impacted sub-sectors were transportation equipment and the auto sector, which fell 21.6 percent and 5.2 percent, respectively.

On the positive side, finance and insurance experienced growth of 0.7 percent, with investment services and funds contributing 3.5 percent growth to the sector. StatsCan indicated that the US tariff announcement on April 2 led to increased selling activity in Canadian equity markets.

The Canadian resource sector was flat overall during the month. The oil and gas extraction, excluding oil sands, fell 1.1 percent in April, while oil sands extraction remained unchanged. The agency said that higher bitumen extraction was offset by lower synthetic crude production. Additionally, a temporary shutdown in the Keystone pipeline due to a rupture contributed to a decline in activity.

However, losses were offset by a 4.8 percent gain in support activities for the mining and oil and gas extraction subsectors, with an increase in rigging and drilling activities.

While some of the month-over-month decline was due to the increase in output in March, StatsCan suggests that further slowing is on the way. The agency reported that advanced figures for May show a further 0.1 decline, noting a decrease in the mining, quarrying, and oil and gas extraction category.

South of the border, the US Bureau of Economic Activity released May’s personal consumption expenditures price index (PCE) data on Friday. The index is a key inflation indicator and is the preferred measure used by the Federal Reserve when making its rate decision. The central bank has held its current rate at the 4.25 to 4.5 percent range since it last lowered it in November 2024.

The report shows inflation ticked up 2.3 percent on an annualized basis, higher than the 2.2 percent recorded in April. The increase came after two consecutive months of slowing from 2.7 percent in February and 2.3 percent in March.

Less the more volatile food and energy categories, PCE gained 2.7 percent during the period. While costs for goods increased, current-dollar personal income was down 0.4 percent and disposable income fell 0.6 percent.

US President Donald Trump again signaled his displeasure with the slow pace of rate cuts earlier in the week, and with the Wall Street Journal reporting on Wednesday (June 25) that he may announce a replacement for Chairman Jerome Powell as early as this summer.

While it’s unclear if he will try to remove Powell from the post, the president may try to create a “shadow Fed” that could work to influence markets and undermine decisions made by the current chairman. Powell’s term as chairman is set to expire in May 2026, while his time as board governor won’t end until 2028. His removal would require an act of Congress.

Markets and commodities react

In Canada, major indexes ended the week up. The S&P/TSX Composite Index (INDEXTSI:OSPTX) gained 0.77 percent during the week to close at 26,687.14 on Friday. The S&P/TSX Venture Composite Index (INDEXTSI:JX) fared better, gaining 1.47 percent to 724.26, while the CSE Composite Index (CSE:CSECOMP) climbed 0.74 percent to 117.39.

US equities were also in positive territory this week, with the S&P 500 (INDEXSP:INX) gaining 3.41 percent to close at a record high of 6,173.08, the Nasdaq-100 (INDEXNASDAQ:NDX) surging 4.17 percent to its own all-time high of 22,534.20. While it didn’t break its previous high, the Dow Jones Industrial Average (INDEXDJX:.DJI) also climbed significantly, up 3.89 percent to 43,819.26.

On the other hand, the gold price declined this week, falling 2.8 percent to US$3,274.15 by Friday at 4 p.m. EDT. The silver price ended the week down just 0.05 percent at US$35.99.

In base metals, the COMEX copper price surged 5.59 percent over the week to US$5.12 per pound. Prices have been rising due to increased purchases ahead of US tariffs and significant drawdowns of inventories in London Metals Exchange warehouses.

Meanwhile, the S&P GSCI (INDEXSP:SPGSCI) lost 6.07 percent to close at 545.71.

Top Canadian mining stocks this week

How did mining stocks perform against this backdrop?

Take a look at this week’s five best-performing Canadian mining stocks below.

Stock data for this article was retrieved at 4 p.m. EDT on Friday using TradingView’s stock screener. Only companies trading on the TSX, TSXV and CSE with market capitalizations greater than C$10 million are included. Mineral companies within the non-energy minerals, energy minerals, process industry and producer manufacturing sectors were considered.

1. Onyx Gold (TSXV:ONYX)

Weekly gain: 121.28 percent
Market cap: C$106.84 million
Share price: C$2.08

Onyx Gold is an exploration company advancing its Munro-Croesus project, located near Timmins in Ontario, Canada. The company has increased the size of the land package by 200 percent between 2020 and 2025, and the project now covers an area of 109 square kilometers.

Munro-Croesus hosts the historic Croesus mine, which produced 14,859 ounces of gold between 1915 and 1936 with an average grade of 95.3 grams per metric ton (g/t). Onyx is the first company to explore the property since the mine closed.

Shares in Onyx have seen gains in recent weeks as it made several investment and project announcements.

The first came on June 12, when the company announced that it had completed a private placement with Windfall Mining, a subsidiary of Gold Fields (NYSE:GFI), which purchased 9.4 percent of Onyx’s issued and outstanding shares. Onyx said the investment is an endorsement of its long-term vision.

As for this week, on Tuesday (June 24), Onyx announced that it signed a mineral property purchase and sale agreement to acquire a 100 percent interest in the Munro and Hewitt properties, both located near the existing Munro-Croesus project. The acquisition will expand the company’s land package to 109 square kilometers from the previous 95 square kilometers.

In its most recent update on Thursday (June 26), the company reported the first drill results from its 10,000 meter spring drill program at the Argus North zone at Munro-Croesus. One highlighted assay contained 1.8 grams per metric ton (g/t) gold over 91 meters, including 4 g/t over 32 meters and 5.3 g/t over 17 meters.

The company said the results demonstrate the continuity of broad zones of high-grade gold mineralization. It added that mineralization was confirmed along strike and that the zone is still open in all directions.

2. US Copper (TSXV:USCU)

Weekly gain: 83.33 percent
Market cap: C$14.5 million
Share price: C$0.11

US Copper is an exploration company working to advance its Moonlight-Superior project in Northeast California, United States.

The project covers approximately 13 square miles of patented and unpatented federal mining claims in the Lights Creek Copper District, near the Nevada border.

A preliminary economic assessment released on January 6 demonstrated a post-tax net present value of US$1.08 billion with an internal rate of return of 23 percent and a payback period of 5.3 years, assuming a copper price of US$4.15 per pound.

The included mineral resource estimate shows a total indicated resource of 2.5 billion pounds of copper, 21.7 million ounces of silver and 140,042 ounces of gold from 402.83 million metric tons of ore with a grade of 0.31 percent copper, 1.85 parts per million (ppm) silver and 0.012 ppm gold. The majority is hosted at its Moonlight and Superior deposits.

Although the company did not release news this week, its shares have seen significant gains alongside a rising price of copper.

3. ArcWest Exploration (TSXV:AWX)

Weekly gain: 68.42 percent
Market cap: C$11.21 million
Share price: C$0.16

ArcWest Exploration is an exploration company that has most recently been working to advance its Todd Creek and Oweegee Dome properties within the Golden Triangle in British Columbia, Canada.

The Todd Creek property is a 21,343 hectare site that adjoins Newmont’s (TSX:NGT,NYSE:NEM) Brucejack property and hosts widespread copper and gold mineralization. Historical exploration of the site yielded grab samples with up to 37.7 g/t gold and 5.3 percent copper. The project is covered by a March 2023 earn-in agreement with Freeport-McMoRan (NYSE:FCX) that could see Freeport earn a 51 percent stake, with C$20 million in investments over a five year period.

The 31,077 hectare Oweegee Dome property is located 34 kilometers northeast of the Brucejack mine and hosts underexplored copper and gold systems, including Delta and Skowill East. Oweegee Dome is covered by a July 2021 option agreement with Sanatana Resources (TSXV:STA). Under the terms of the agreement, Sanatana can earn an initial 60 percent interest in the property through cumulative exploration investments of C$6.6 million over four years.

Shares in ArcWest gained this week after a pair of announcements.

The first came on Wednesday, when the company reported results from a 2024 drill program, funded and operated by Sanatana, that extended the mineralized zone at Oweegee Dome. Sanatana President Buddy Doyle said, “We now think the alteration and mineralization we see at surface at Delta is only the southeast corner of a larger system.”

The other news was released on Thursday, when it announced it had mobilized for a drill program at Todd Creek. The program will receive a minimum of C$4 million in funding from Freeport-McMoRan.

4. Belo Sun (TSXV:BSX)

Weekly gain: 62.79 percent
Market cap: C$163.35 million
Share price: C$0.35

Belo Sun Mining is an exploration and development company focused on advancing its Volta Grande gold project in Brazil.

The property covers approximately 2,400 hectares within the Tres Palmeiras greenstone belt in Para State, Brazil. The company has been working on the project since 2003, and acquired necessary development permits in 2014 and 2017.

A 2015 mineral reserve estimate demonstrated a proven and probable reserve of 3.79 million ounces of gold from 116 million metric tons of ore with an average grade of 1.02 g/t.

Development at the site stalled in 2018 after a federal judge ruled that the Federal Brazilian Institute of the Environment (IBMA) would be the competent authority for issuing environmental permits. The decision was overturned in 2019 with the Secretariat of Environment and Sustainability of the State of Para (SEMAS) reassuming its permitting authority. The decision was once again reversed in September 2023, returning authority to IBMA.

On January 23, Belo Sun announced that the Federal Court of Appeals had reassigned SEMAS as the permitting authority for the Volta Grande project. The company said it was pleased with the decision, as the agency is familiar with the project and enjoys a constructive and transparent relationship with it.

On Monday (June 23), the company announced shareholders approved a renewal of the company’s governance structure and elected four new directors to the board. Four of the board’s six members are now either Brazilian or have spent significant parts of their careers working in Brazil.

5. Reyna Silver (TSXV:RSLV)

Weekly gain: 52.94 percent
Market cap: C$33.05 million
Share price: C$0.13

Reyna Silver is a silver exploration company with a portfolio of assets in Chihuahua, Mexico, and Nevada, US.

One of its two Mexican assets is Guigui, a 4,750 hectare property covering a significant portion of the Santa Eulalia Mining District. The area has a history of mining dating back to the 1700s with production of almost 450 million ounces of silver between then and 2001.

Its other one is Batopilas, a 1,183 hectare site that covers 94 percent of the Batopilas Mining District, which has significant deposits of pure, native silver. Historic mining at the site produced an estimated 200 million to 300 million ounces of silver dating back to the mid-1600s.

Its primary American asset is the Gryphon Summit project located along the Carlin-trend. The project covers an area of 10,300 hectares and is prospective for gold, silver and critical minerals.

It also owns the Medicine Springs project, which spans 4,831 hectares south of Elko City. Previous exploration at the site identified lead, zinc and silver mineralization.

Shares in Reyna gained this week after it entered into a definitive agreement to be acquired by Torex Gold (TSX:TXG).

The deal, valued at US$26 million, will see Torex acquire all issued and outstanding common shares in Reyna, thereby gaining access to its wholly owned Mexican portfolio. Additionally, Torex will have the option to acquire a 70 percent stake in the Gryphon Summit project and a 100 percent interest in Medicine Springs.

FAQs for Canadian mining stocks

What is the difference between the TSX and TSXV?

The TSX, or Toronto Stock Exchange, is used by senior companies with larger market caps, and the TSXV, or TSX Venture Exchange, is used by smaller-cap companies. Companies listed on the TSXV can graduate to the senior exchange.

How many mining companies are listed on the TSX and TSXV?

As of February 2025, there were 1,572 companies listed on the TSXV, 905 of which were mining companies. Comparatively, the TSX was home to 1,859 companies, with 181 of those being mining companies.

Together the TSX and TSXV host around 40 percent of the world’s public mining companies.

How much does it cost to list on the TSXV?

There are a variety of different fees that companies must pay to list on the TSXV, and according to the exchange, they can vary based on the transaction’s nature and complexity. The listing fee alone will most likely cost between C$10,000 to C$70,000. Accounting and auditing fees could rack up between C$25,000 and C$100,000, while legal fees are expected to be over C$75,000 and an underwriters’ commission may hit up to 12 percent.

The exchange lists a handful of other fees and expenses companies can expect, including but not limited to security commission and transfer agency fees, investor relations costs and director and officer liability insurance.

These are all just for the initial listing, of course. There are ongoing expenses once companies are trading, such as sustaining fees and additional listing fees, plus the costs associated with filing regular reports.

How do you trade on the TSXV?

Investors can trade on the TSXV the way they would trade stocks on any exchange. This means they can use a stock broker or an individual investment account to buy and sell shares of TSXV-listed companies during the exchange’s trading hours.

Article by Dean Belder; FAQs by Lauren Kelly.

Securities Disclosure: I, Dean Belder, hold no direct investment interest in any company mentioned in this article.

Securities Disclosure: I, Lauren Kelly, hold no direct investment interest in any company mentioned in this article.

This post appeared first on investingnews.com

Freegold Ventures Limited (TSX: FVL) (OTCQX: FGOVF) (‘Freegold’ or the ‘Company ‘) is pleased to announce that all matters set out in the Management Information Circular dated May 26 2025 for the 2025 Annual General and Special Meeting of Shareholders held on June 27, 2025 (the ‘Meeting’) were approved by the shareholders holding 98,154,137 shares were voted representing approximately ~ 18.56% of the outstanding shares of the Company.

The following nine nominees were elected as directors of Freegold. The detailed results of the vote for the election of directors are set out below:

MOTIONS

NUMBER OF SHARES

PERCENTAGE OF VOTES CAST

FOR

AGAINST

WITHHELD/
ABSTAIN

FOR

AGAINST

WITHHELD/
ABSTAIN

To elect as Director :Kristina Walcott

96,353,303

1,800,834

98.165 %

1.835 %

To Elect as Director: Alvin Jackson

97,016,593

1,137,544

98.841 %

1.159 %

To Elect as Director: David Knight

85,790,018

12,364,119

87.403 %

12.597 %

To Elect as Director: Garnet Dawson

97,308,977

845,160

99.139 %

0.861 %

To Elect as Director: Ron Ewing

96,839,477

1,314,660

98.661 %

1.339 %

To Elect as Director: Glen Dickson

85,396,927

12,757,210

87.003 %

12.997 %

To Elect as Director: Reagan Glazier

79,513,338

18,640,799

81.009 %

18.991 %

To Elect as Director: Maurice Tagami

97,900,807

253,330

99.742 %

0.258 %

To Elect as Director: Vivienne Artz

93,614,569

4,539,568

95.375 %

4.625 %

The Company’s shareholders approved the appointment of Davidson & Company LLP, Chartered Professional Accountants, as the Company’s auditors, as set forth in the management information circular.

The Company’s shareholders approved the Company’s new omnibus equity incentive plan.

Each of the matters voted upon at the Meeting is discussed in detail in the Company’s Information Circular dated May 26 th, 2025, which is filed under the Company’s profile at www.sedarplus.com.

Golden Summit Project Update:

Drilling at Golden Summit is progressing well. Drilling is focused on resource definition, which includes both expansion and infill drilling, as well as geotechnical and metallurgical holes. Like the 2024 drill program, the current efforts aim to upgrade inferred resources to indicated status in preparation for the upcoming pre-feasibility study, which is expected to commence later this year. An updated mineral resource estimate is expected to be finalised soon, and the initial assay results from the 2025 drill program are also anticipated shortly.

The Qualified Person for this release is Alvin Jackson , P.Geo., Vice President of Exploration and Development for Freegold, who has approved the scientific and technical disclosure in this news release.

About Freegold Ventures Limited  
Freegold is a TSX-listed company focused on exploration in Alaska . It holds the Golden Summit Gold Project near Fairbanks and the Shorty Creek Copper-Gold Project near Livengood through leases.

Some statements in this news release contain forward-looking information, including, without limitation, statements as to planned expenditures and exploration programs, potential mineralization and resources, exploration results, the completion of an updated NI 43-101 technical report, and any other future plans. These statements address future events and conditions and, as such, involve known and unknown risks, uncertainties, and other factors which may cause the actual results, performance, or achievements to be materially different from any future results, performance, or achievements expressed or implied by the statements. Such factors include, without limitation, the completion of planned expenditures, the ability to complete exploration programs on schedule, and the success of exploration programs. See Freegold’s Annual Information Form for the year ended December 31st, 2024 , filed under Freegold’s profile at www.sedar.com , for a detailed discussion of the risk factors associated with Freegold’s operations. On January 30, 2020 , the World Health Organization declared the COVID-19 outbreak a global health emergency. Reactions to the spread of COVID-19 continue to lead to, among other things, significant restrictions on travel, business closures, quarantines, and a general reduction in economic activity. While these effects have been reduced in recent months, the continuation and re-introduction of significant restrictions, business disruptions, and related financial impact, and the duration of any such disruptions cannot be reasonably estimated. The risks to Freegold of such public health crises also include employee health and safety risks and a slowdown or temporary suspension of operations in geographic locations impacted by an outbreak. Such public health crises, as well as global geopolitical crises, can result in volatility and disruptions in the supply and demand for various products and services, global supply chains, and financial markets, as well as declining trade and market sentiment and reduced mobility of people, all of which could affect interest rates, credit ratings, credit risk, and inflation. As a result of the COVID-19 outbreak, Freegold has implemented a COVID management program and established a full-service Camp at Golden Summit to attempt to mitigate risks to its employees, contractors, and community. While the extent to which COVID-19 may impact Freegold is uncertain, it is possible that COVID-19 may have a material adverse effect   on Freegold’s business, results of operations, and financial condition.

SOURCE Freegold Ventures Limited

View original content to download multimedia: http://www.newswire.ca/en/releases/archive/June2025/27/c9322.html

News Provided by Canada Newswire via QuoteMedia

This post appeared first on investingnews.com

Compound (COMP) has shed 12% of its value, and is facing the risk of another crash after crypto venture firm a16z moved 300,000 tokens to Coinbase. Meanwhile, a descending triangle pattern hints at a potential 27% crash for Compound price if it loses a key support level. COMP is trading at $45.87 today, June 28,

The post Is Compound Price Set for 27% Crash as a16z Dumps 13.75M COMP? appeared first on CoinGape.

In a big bet by the latest crypto leader in tokenization of equity shares, the leading crypto Exchange Gemini has made a big announcement. Announced on Friday, Gemini has partnered with RWA Startup, Dinari, to offer tokenized shares in European Union (EU). It has started the roll out of tokenized shares on its Platform with

The post Gemini Partners With RWA Startup Dinari To Tokenize Equity Shares appeared first on CoinGape.

Bitcoin (BTC) teeters just below its peak at $107,249, less than 5% away from reclaiming its $112,000 all-time high. However, the S&P 500 hit a historic 6,223.75 high, fueled by five straight bullish candles. Will BTC follow the market’s surge to new highs, or is a pullback on the horizon? S&P 500 Hits Record High

The post Bitcoin Price Prediction As S&P500 Books All time high appeared first on CoinGape.

MACD, ADX and S&P 500 action frame Joe Rabil’s latest show, where a drifting index push him toward single-stock breakouts. Joe spotlights the daily and weekly charts of American Express, Fortinet, Parker-Hannifin, Pentair, and ServiceNow as showing strong ADX/MACD characteristics. He outlines how the patterns showing on these charts can outshine the broad market until momentum confirms a larger move.

The video premiered on June 25, 2025. Click this link to watch on Joe’s dedicated page.

Archived videos from Joe are available at this link. Send symbol requests to stocktalk@stockcharts.com; you can also submit a request in the comments section below the video on YouTube. Symbol Requests can be sent in throughout the week prior to the next show.

Over a month ago, Super Micro Computer, Inc. (SMCI) appeared on our StockCharts Technical Rank (SCTR) Top 10 list. SCTRs are an exclusive StockCharts tool that can help you quickly find stocks showing strong technical strength relative to other stocks in a similar category.

Now, the stock market is dynamic, and SMCI, like many stocks, went through a consolidation period with its price trading within a certain range. While SMCI was basically moving sideways, other stocks, such as Palantir Technologies, Inc. (PLTR), Robinhood Markets Inc. (HOOD), and Roblox Corp. (RBLX), took their turn on the Top 10 SCTR list.

Spotting SMCI’s Potential Turnaround

After over a month of this sideways movement, SMCI is starting to show signs of a breakout. This can often be a sign of renewed strength for a stock to move higher, though there’s no guarantee.

A significant factor behind SMCI’s rise is the strength in AI-related tech stocks, which has given the broader market a big boost. The Nasdaq 100 ($NDX) hit record highs, and other major indexes such as the Nasdaq Composite ($COMPQ) and S&P 500 ($SPX) are just a hair away from hitting their record highs. For as long as this positive trend remains in place, SMCI will likely ride higher with the market.

Let’s break down SMCI’s daily chart.

FIGURE 1. DAILY CHART OF SMCI STOCK. SMCI broke out of a trading range and has the potential to rise higher if momentum strengthens. Monitor momentum indicators such as the RSI and PPO.Chart source: StockCharts.com. For educational purposes.

SMCI’s SCTR score was at 95.5 after Thursday’s close. The stock is trading comfortably above its 50-day simple moving average, its relative strength index (RSI) is approaching the 70 level, and the percentage price oscillator (PPO) is starting to show encouraging signs of positive momentum (see daily chart below).

Since SMCI has hit a high of $122.90, your initial thought might be that the stock has significant upside potential. It very well could. However, a key part of smart investing is understanding and managing risk. You know very well that any negative news headline is bound to send SMCI tumbling back to its lows; after all, it’s happened before.

Let’s say you spotted this breakout. The ideal approach is to wait for a pullback and a reversal back to the upside with strong follow-through before entering a long position. However, given the stock is moving relatively quickly, you let FOMO get to you and decided to enter a long SMCI position at around $48.

With the stock closing near its high for the day, there is the possibility of a higher move at the open, short of any negative news. But nothing is guaranteed, and you need downside protection for your position. Initially, your stop loss would be the top end of SMCI’s trading range. But what about your upside price targets?

For this, I turned to the weekly chart of SMCI and, using the annotation tool, added Fibonacci retracement levels from the March 2024 high to the November low.

FIGURE 2. WEEKLY CHART OF SMCI STOCK. Annotating Fibonacci retracement levels from the March 2024 high to the November 2024 low is one way to identify price targets.Chart source: StockCharts.com. For educational purposes.

Your first price target could be the 38.2% level, which falls just below $60. This aligns with the February high and was an area where the stock price stalled during August 2024 before it continued lower. If SMCI’s stock price hits that level, don’t be surprised if it wavers here. It could continue higher or fall lower depending on investor sentiment toward AI stocks.

Closing Position

Remember, protecting your capital is of utmost importance, regardless of whether the trade goes in your favor or not. Use stops with discipline, since stocks like SMCI can move both up and down quickly. Your objective should be to keep your losses small and let your profits run until the upside momentum dries up.


Disclaimer: This blog is for educational purposes only and should not be construed as financial advice. The ideas and strategies should never be used without first assessing your own personal and financial situation, or without consulting a financial professional.

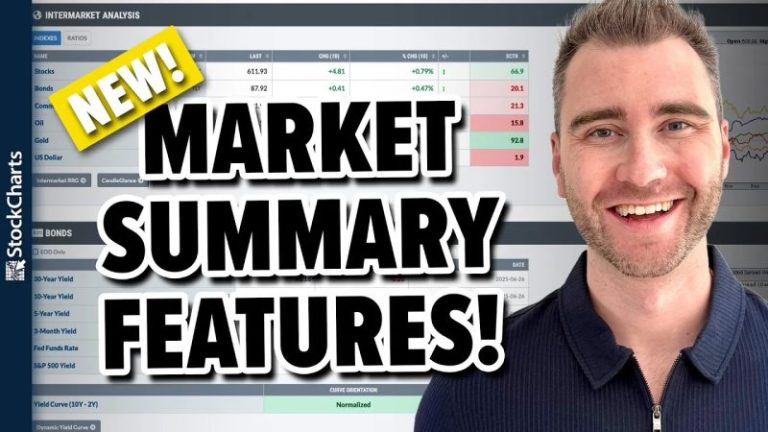
Take a tour of the FIVE latest updates and additions to our fan-favorite, professionally-curated Market Summary dashboard with Grayson!

In this video, Grayson walks viewers through the new charts and indexes that have been added to multiple panels on the page. These include mini-charts for the S&P sectors, a new index-only put/call ratio, intermarket analysis ratios to compare performance across asset classes, and a massive collection of key economic indexes that you can track like a pro. Plus, Grayson will show you how to install the accompanying Market Summary ChartPack – a pre-built collection of over 30 organized ChartLists designed to enhance your use of the Market Summary dashboard page.

This video originally premiered on June 26, 2025. Click on the above image to watch on our dedicated Grayson Roze page on StockCharts TV.

You can view previously recorded videos from Grayson at this link.

The S&P 500 ($SPX) just logged its second consecutive 1% gain on Tuesday. That’s three solid 1% advances so far in June. And with a few trading days remaining in the month, the index has recorded only one 1% decline so far.

A lot can still happen before the month ends, but, as it stands, June is looking a lot like May, which also saw three 1% gains and one 1% loss. Taken together, these months resemble May and June of last year, although back then the S&P 500 advanced 52 consecutive sessions without a single 1% decline.

What this means for you: After the volatility of March and April—and the sharp rebound in mid-April—there has been a notable shift toward a more consistent uptrend. We talk about this frequently, and it bears repeating: the characteristics of a steady uptrend are unmistakable. It’s the foundation of our analysis that shapes our market outlook.

FIGURE 1. THE NUMBER OF 1% MOVES IN THE S&P 500 IN 2024 AND 2025. June is looking similar to May, which also saw three 1% gains and one 1% loss. It’s echoing the behavior we saw in May and June of 2024.

It all starts with daily price action. Low two-way volatility has set the tone in recent weeks. If this type of month-to-month tempo in daily moves continues, the uptrend can persist. The opposite, of course, is also true.

Zooming In On the Short-Term Moves

Looking at the S&P 500’s recent price action on the short-term chart, the index is now approximately +3% from its recent low last Friday. If this multi-day bounce were to stop now, it would be among the smallest over the last nine months. Indeed, most didn’t get much further before the next bout of profit taking, but this shows how the staircase-like advance could continue.

In other words, if this cadence persists, the S&P 500 could meander through its former highs, i.e., we may not see a resounding breakout. The more boring a move through 6,147, the better.

FIGURE 2. TWO-HOUR CHART OF THE S&P 500. The staircase-like advance in $SPX could continue, and the index could tiptoe through previous highs.

Also, notice how the recent drawdown only pulled the 14-period relative strength index (RSI) on this two-hour chart marginally below the 50 level, which shows that the momentum shift was limited last week. It’s a reminder of how weak the bounce attempt was in March, which set the stage for the second down leg of that move. If the reverse is now true, then another up leg could be afoot soon.

NVDA Stock: A Daily Perspective

NVDA made a new all-time high on Wednesday, the first since January 7. Its participation since the April 7 low has been a major and necessary piece to the SMH, XLK, NDX, and SPX’s rallies, and the global equity market’s overall comeback. 

We last cited the stock on May 27 and May 29 (before and right after it reported earnings), noting the bull flag pattern. The flag has held throughout, and NVDA is now close to achieving that price target. So, what’s next?

FIGURE 3: DAILY CHART OF NVDA’S STOCK PRICE. After the bull flag pattern, NVDA is close to achieving its price target.

NVDA vs. 200-Day Moving Average

NVDA’s comeback has pulled the stock back above its 200-day moving average. We’ve shown this before as the stock was coming back. The last few times NVDA reclaimed the long-term line after spending a long time below it, the stock advanced higher for years.

FIGURE 4. DAILY CHART OF NVDA WITH 200-DAY MOVING AVERAGE. The last few times NVDA broke above its 200-day moving average after spending a long time below it, the stock advanced higher for years.

NVDA Stock: A Weekly Perspective

Even though NVDA made a marginal new high in early January, there was no follow-through. Thus, NVDA remains net flat since November 2024 and isn’t too far above its spike highs from last June either.

Altogether, the round trip can now be viewed as one big bullish pattern. We’ve seen similar formations play out three times since the October low. Once NVDA finally got through those volatile periods and broke out, those strong extensions that we all remember well ensued. Past performance is no guarantee of future returns, but patterns tend to repeat no matter the timeframe. So, we need to respect that the same kind of breakout could happen again with the stock is sitting at the same levels as it was eight months ago, but with strong market-wide demand at its back.

FIGURE 5. WEEKLY CHART OF NVDA. Could a breakout with strong market-wide demand occur?

NVDA – GoNoGo

NVDA’s weekly trend just flipped to positive on the GoNoGo chart, as well. As is clear, the last time this happened was in early 2023, the same time that the first bullish pattern on the preceding chart happened.

FIGURE 6. NVDA’S PRICE ACTION USING GONOGO CHART. The weekly trend just switched to positive. This happened in 2023, which is around the time the first bullish pattern occurred in the weekly chart in Figure 5.

NVDA Stock: A Monthly Perspective

Zooming way out, this also could be the fourth major breakout from a monthly perspective. The prior ones happened in 2015, 2020, and 2023.

FIGURE 7. MONTHLY CHART OF NVDA. There could be a fourth major breakout in NVDA’s stock price.

The Bottom Line

If you’re someone who likes to stay invested with an eye on the long-term, this is the kind of environment where patience pays off. The S&P 500 appears to be building strength, and NVDA is helping lead the charge.