Author

admin

Browsing

This opinion piece was submitted to the Investing News Network (INN) by Darren Brady Nelson, who is an external contributor. INN believes it may be of interest to readers and has copy edited the material to ensure adherence to the company’s style guide; however, INN does not guarantee the accuracy or thoroughness of the information reported by external contributors. The opinions expressed by external contributors do not reflect the opinions of INN and do not constitute investment advice. All readers are encouraged to perform their own due diligence.

By Darren Brady Nelson

As an economist, I, perhaps somewhat sadly, have many economist friends. One of them recently alerted me to a post on X that was even a shock to me in the toxic 2020s. That being: “Almost all political donations by Fed employees go to one party. The Fed is already politicized.”

The post had a link to the data supporting this assertion, which was published at OpenSecrets. They are a “501(c)3” devoted to: “tracking money in US politics and its effect on elections and public policy.” Their theme is appropriately “Follow the Money,” as it is for this story.

Political money contributions, since 2016, from those at the Fed, range between 92 to 93 percent for Democrats and 8 to 9 percent for Republicans. As Public Choice economics teaches, it is crucial to “Follow the Money” in politics. Austrian and Chicago schools of economics teach the same for gold.

Gold pricing 101

Gold pricing is often characterized as being driven by “fear and uncertainty,” at least in the short run, including geopolitical fears like war and economic uncertainties such as recession. It is also typically recognized to be an “inflation hedge,” in the long run anyway.

Gold is an asset with a price determined in a 24/7/365 global auction, most often quoted per troy ounce, in the world’s reserve currency of US dollars. New supply plays an unusually small role compared to almost all other commodities, goods or services. Thus, highest bid wins.

Perhaps none of these things about gold, and its price, are new nor surprising. But what might be, despite the end of the gold standard in 1971 and legalization of gold investment in 1974, is that gold is still a shadow currency to fiat ones, especially US dollar, in the ‘always run.’

The annual gold price from 1960 to 2024 is displayed below, as sourced from the World Bank. Rises include: late 1970s; late 2000s; and mid 2020s. Slides include: early 1980s; late 1990s; and early 2010s. Overall growth was: Sum 555 percent; Ave 8.7 percent; Max 98 percent; Min 24 percent; and CAGR 6.8 percent.

Gold yearly growth ($).

Source: World Bank.

Money supply 101

Gold is the inflation hedge, precisely because it is shadow currency. Money supply is the inflation source, precisely because it is fiat currency. As Chicago economist Milton Friedman wrote in Money Mischief (1994): “In the modern world, inflation is a printing-press phenomenon.”

There are multiple money supply measures, such as M0, M1, M2 and M3. M1 includes paper and coin currency held by the general public as well as liquid bank deposits (e.g. checking accounts). M3 includes M1, plus less liquid bank deposits (e.g. savings accounts) as well as “repos.”

Austrian economist Robert Murphy details in Understanding Money Mechanics (2021) just how the Fed’s printing, Treasury bonds and bank loans create US money supply, through open market operations. Since 2008 and 2020, the Fed has expanded to buying and selling just about anything.

Speaking on behalf of the Fed, and all major central banks, the Bank of England wrote in Money Creation in the Modern Economy (2014): “(B)ank lending creates deposits. At that moment, new money is created. (This is) ‘fountain pen money,’ created at the stroke of bankers’ pens(.)”

Annual M1 and M3 money supply from 1960 to 2024 are displayed below, as sourced from the OECD. M3 starts to take off from the mid 1990s. Both blast off in the early 2020s, M1 in part due to redefinition. Combined growth was: Sum 533 percent; Ave 8.3 percent; Max 126 percent; Min 6.4 percent; and CAGR 7.4 percent.

Money yearly growth ($).

Source: OECD.

Gold inflation 101

Christian economist Gary North points out in Honest Money (2011) that businesses have three choices in the face of money inflation: A) profit deflation; B) price inflation; C) quality shrinkflation. Investors have a fourth: D) gold inflation. A, B, and C are all bad options. D is good.

The chart below shows cumulative annual growth of gold versus M1 and M3. Gold performs and protects against both M1 and M3 from 1974 to 2019, even in 2001, but not against M1 from 2020 to 2024. In 2019, gold had a 150 percent lead on M1 and 92 percent on M3. By 2022, it shrunk to 110 percent and 80 percent.

Cumulative yearly growth (percent).

Sources: OECD and World Bank.

A 2020 regression study found: “When the Federal Reserve increases money supply by 1%, gold prices increase by 0.94%.” A 2023 academic paper: “Confirms a long-term relationship between gold price and US M2.” Note that M1’s 2021 redefinition has now made it nearly identical to M1.

Period yearly change (percent).

Sources: OECD and World Bank.

However, the authors of Austrian School for Investors (2015) wrote: “Gold does not correlate with the rate of inflation as such, but with the rate of change of the inflation rate. In order to buttress this hypothesis, we calculated the regression depicted in (the chart below).”

Source: Austrian School for Investors: Austrian Investing between Inflation and Deflation.

In conclusion, as per my Wokenomics 101 (2023) ghost blog, money inflation by: “increasing demand puts upward pressure on price and quantity and downward pressure on quality.” That puts upward pressure on: nominal CPI and GDP statistics; as well as real gold investment and price.

Inflation doesn’t harm all. It helps some. They are the “Bootleggers and Baptists,” as Public Choice economist Bruce Yandle dubbed them in 1983. Bootleggers are crony capitalists, politicians and bureaucrats whose inflated revenue outpaces costs. Baptists are the “useful idiots.”

Thus, “Follow the Money” back to the “inflationistas” of: Big Business; Big Government; and Big Banks. All gain supernormal profits from easy money: one, making more money; two, collecting more money; and three, creating more money. Also, “Follow the Money” when it comes to gold.

And, sadly, there is one policy that is always bipartisan; print more money. But, gladly, gold will always win.

About Darren Brady Nelson

Darren Brady Nelson is chief economist with Fisher Liberty Gold and policy advisor to The Heartland Institute. He previously was economic advisor to Australian Senator Malcolm Roberts. He authored the Ten Principles of Regulation and Reform, and the CPI-X approach to budget cuts.

This post appeared first on investingnews.com

Strong demand in the face of looming supply shortages has pushed copper to new heights in recent years.

With a wide range of applications in nearly every sector, copper is by far the most industrious of the base metals. In fact, for decades, the copper price has been a key indicator of global economic health, earning the red metal the moniker “Dr. Copper.” Rising prices tend to signal a strong global economy, while a significant longer-term drop in the price of copper is often a symptom of economic instability.

After bottoming out at US$2.17 per pound, or US$5,203.58 per metric ton (MT), in mid-March 2020, copper has largely been on an upward trajectory.

Why is copper so expensive in 2025? Higher copper prices over the past few years have largely been attributed to a widening supply/demand gap. The already tenuous copper supply picture was made worse by COVID-19 lockdowns, and as the world’s largest economies seemingly began to emerge from the pandemic, demand for the metal picked up once again. Copper mining and refining activities simply haven’t kept up with the rebound in economic activity.

In this article

    What key factors drive the price of copper?

    Robust demand has long been one of the strongest factors driving copper prices. The ever-growing number of copper uses in everyday life — from building construction and electrical grids to electronic products and home appliances — make it the world’s third most-consumed metal.

    Copper’s anti-corrosive and highly conductive properties are why it’s the go-to metal for the construction industry, and it’s used in products such as copper pipes and copper wiring. In fact, construction is responsible for nearly half of global copper consumption. Rising demand for new homes and home renovations in both Asian and Western economies is expected to support copper prices in the long term.

    In recent decades, copper price spikes have been strongly tied to rising demand from China as the economic powerhouse injects government-backed funding into new housing and infrastructure. Industrial production and construction activity in the Asian nation have been like rocket fuel for copper prices.

    Additionally, copper’s conductive properties are increasingly being sought after for use in renewable energy applications, including thermal, hydro, wind and solar energy.

    However, the biggest driver of copper consumption in the renewable energy sector is rising global demand for electric vehicles (EVs), EV charging infrastructure and energy storage applications. As governments push forward with transportation network electrification and energy storage initiatives as a means to combat climate change, copper demand from this segment is expected to surge.

    New energy vehicles use significantly more copper than internal combustion engine vehicles, which only contain about 22 kilograms of copper. In comparison, hybrid EVs use an average of 40 kilograms, plug-in hybrid EVs use 55 kilograms, battery EVs use 80 kilograms and battery electric buses use 253 kilograms.

    In 2024, EV sales worldwide increased by 25 percent over 2023 to come in at about 17.1 million units, and analysts at Rho Motion expect that trend to continue in the coming years despite some headwinds in the near-term. Already in the first five months of 2025, EV sales were up 28 percent over the same period in the previous year.

    On the supply side of the copper market, the world’s largest copper mines are facing depleting high-grade copper resources, while over the last decade or more new copper discoveries have become few and far between.

    The pandemic made the situation worse as mining activities in several top copper-producing countries faced work stoppages and copper companies delayed investments in further exploration and development — a challenging problem considering it can take as many as 10 to 20 years to move a project from discovery to production. In addition, delayed investments amid the pandemic will also have long-term repercussions for copper supply.

    There have also been ongoing production issues at major copper mines, most notably the shutdown in late 2023 of First Quantum Minerals’ (TSX:FM,OTC Pink:FQVLF) Cobre Panama mine, which accounted for about 350,000 MT of the world’s annual copper production.

    The International Energy Agency (IEA) is forecasting a 30 percent shortfall in the amount of copper needed to meet demand by 2035. “This will be a major challenge. It’s time to sound the alarm,” IEA Executive Director Fatih Birol said.

    The supply shortage has increased the need for end users to turn to the copper scrap market to make up for the supply shortage. Sometimes referred to as “the world’s largest copper mine,” recycled copper scrap contributes significantly to supplying and balancing the copper market.

    “We are seeing signs this could change. Much of the growth over the last five years has come from brownfield expansions rather than greenfield/new discoveries,’ she said. ‘Technology will likely help increase the chance of discovery, and broadly I would say that policymakers are now more supportive of mineral exploration as the push to secure critical raw materials supply has moved up the agenda.’

    Joannides offered some examples of greenfield projects in the pipeline: Capstone Copper’s (TSX:CS,OTC Pink:CSCCF) Santo Domingo in Chile, Southern Copper’s (NYSE:SCCO) Tia Maria in Peru and Teck Resources’ (TSX:TECK.A,TECK.B,NYSE:TECK) Zafranal in Peru.

    How has the copper price moved historically?

    Taking a look back at historical price action, the copper price has had a wild ride for more than two decades.

    Sitting at US$1.38 per pound in late January 2005, the copper price followed global economic growth up to a high of US$3.91 in April 2008. Of course, the global economic crisis of 2008 soon led to a copper crash that left the metal at only US$1.29 by the end of year.

    Once the global economy began to recover in 2011, copper prices posted a new record high of US$4.58 per pound at the start of the year. However, this high was short-lived as the copper price began a five year downward trend, bottoming out at around US$1.95 in early 2016.

    Copper prices stayed fairly flat over the next four years, moving in a range of US$2.50 to US$3 per pound.

    20 year copper price performance.

    Chart via Macrotrends.

    The pandemic’s impact on mine supply and refined copper in 2020 pushed prices higher despite the economic slowdown. The copper price climbed from a low of US$2.17 in March to close out the year at US$3.52.

    In 2021, signs of economic recovery and supercharged interest in EVs and renewable energy pushed the price of copper to rally higher and higher. Copper topped US$4.90 per pound for the first time ever on May 10, 2021, before falling back to close at US$4.76.

    Also affecting the copper price at that time was expectations for higher copper demand amid supply concerns out of two of the world’s major copper producers: Chile and Peru. In late April 2021, port workers in Chile called for a strike, while in Peru presidential candidate Pedro Castillo proposed nationalizing mining and redrafting the country’s constitution.

    In early May 2021, news broke that copper inventories were at their lowest point in 15 years. Expert market watchers such as Bank of America commodity strategist Michael Widmer warned that further inventory declines into 2022 could lead to a copper market deficit.

    After climbing to start 2022 at US$4.52, the copper price continued to spike on economic recovery expectations and supply shortages to reach US$5.02 per pound on March 6. Throughout the first quarter, fears of supply chain disruptions and historically low stockpiles amid rising copper demand drove prices higher.

    However, copper prices pulled back in mid-2022 on worries that further COVID-19 lockdowns in China, as well as a growing mortgage crisis, would slow down construction and infrastructure activity in the Asian nation. Rising inflation and interest hikes by the Fed also placed downward pressure on a wide basket of commodities, including copper. By late July 2022, copper prices were trading down at nearly a two year low of around US$3.30.

    In the early months of 2023 the copper price was trading over the US$4 per pound level after receiving a helpful boost from continuing concerns about low copper inventories, signs of rebounding demand from China, and news about the closure of Peru’s Las Bambas mine, which accounts for 2 percent of global copper production.

    However, that boost turned to a bust in the second half of 2023 as China continued to experience real estate sector issues, alongside the economic woes of the rest of the world. The price of copper dropped to a low for the year of US$3.56 per pound in mid October.

    Elevated supply levels kept copper trading in the US$3.50 to US$3.80 range for much of Q1 2024 before experiencing strong gains that pushed the price of the red metal to US$4.12 on March 18.

    Those gains were attributed to in part to tighter copper concentrate supply following the closure of First Quantum Minerals’ Cobre Panama mine, guidance cuts from Anglo American (LSE:AAL,OTCQX:AAUKF) and declining production at Chile’s Chuquicamata mine. In addition, China’s top copper smelters announced production cuts after limited supply led to lower profits from treatment and refining charges.

    BHP’s (ASX:BHP,NYSE:BHP,LSE:BHP) attempted takeover of Anglo American also stoked fears of even tighter global copper mine supply. These supply-side challenges continued to juice copper prices in Q2 2024, causing a jump of nearly 29 percent from US$4.04 per pound on April 1 to a then all-time high of US$5.20 by May 20, 2024.

    What was the highest price for copper ever?

    The price of copper reached its highest recorded price of US$5.72 per pound, or US$12,610 per metric ton, on July 8, 2025. The red metal’s price surged more than 13 percent from July 7 to its new all time high. Read on to found out how the copper price reached those heights.

    Why did the copper price hit an all-time high in 2025?

    After starting 2025 at US$3.99 per pound, copper prices were lifted in Q1 by increasing demand from China’s economic stimulus measures, renewable energy and artificial intelligence (AI) technologies and stockpiling brought on by fear of US President Trump’s tariff threats.

    At the time, Trump had said the US was considering placing tariffs of up to 25 percent on all copper imports in a bid to spark increased domestic production of the base metal.

    In late February, he signed an executive order instructing the US Commerce Department to investigate whether imported copper poses a national security risk under Section 232 of the Trade Expansion Act of 1962. The price of copper reached a new high price of US$5.24 per pound on March 26 as tariff tensions escalated.

    Trump’s tariff talk sparked yet another copper price rally to set its new record high price in early July when he announced he plans to impose a 50 percent tariff on all imports of the red metal.

    Looking at the bigger picture, copper’s rally in recent years has encouraged bullish sentiment on prices looking ahead. In the longer term, the fundamentals for copper are expected to get tighter as demand increases from sectors such as EVs and energy storage. A May 2024 report from the International Energy Forum (IEF) projects that as many as 194 new copper mines may need to come online by 2050 to support massive demand from the global energy transition.

    Looking over to renewable energy, according to the Copper Development Association, solar installations require about 5.5 MT of copper for every megawatt, while onshore wind turbines require 3.52 MT of copper and offshore wind turbines require 9.56 MT of copper.

    The rise of AI technology is also bolstering the demand outlook for copper. Commodities trader Trafigura has said AI-driven data centers could add one million MT to copper demand by 2030, reports Reuters.

    Where can investors look for copper opportunities?

    Copper market fundamentals suggest a return to a bull market cycle for the red metal in the medium-term. The copper supply/demand imbalance also presents an investment opportunity for those interested in copper-mining stocks.

    Securities Disclosure: I, Melissa Pistilli, hold no direct investment interest in any company mentioned in this article.

    This post appeared first on investingnews.com

    The U.S. shipbuilding industry is looking for help. A South Korean company is answering the call.

    Hanwha Philly Shipyard CEO David Kim, nodding to the gargantuan vessels under construction just off the Delaware River, on Wednesday offered the kind of vision that has brought some optimism back to the U.S. shipbuilding community.

    “You take that level of experience, the technology that we have, the know-how, the process expertise, and so clearly, we believe we have a lot to bring to the Philly Shipyard, as well as to the U.S. maritime industrial base, in terms of modernization capacity,” he said on a walkthrough of the shipyard.

    Hanwha Philly Shipyard CEO David Kim.Obtained by NBC News

    Hanwha Group bought the Philly Shipyard in December for $100 million and plans to invest multiple times that amount in the yard, training over a thousand new workers and bringing in new high-tech equipment. The company hopes to build naval ships and become the first U.S. builder of specialized liquefied natural gas tankers.

    Shipbuilding in the United States has been all but dormant. China, South Korea, Japan and Europe all produce far more ships than the United States, with the few shipyards still operating in the country concentrating on military ships.

    Revitalizing shipbuilding has been one of the areas President Donald Trump has pointed to as part of a broader effort to bring manufacturing back to the United States — a move some see as shortsighted considering the costs associated with building the kind of gigantic modern ships that remain a core part of how goods and commodities move around the planet.

    This post appeared first on NBC NEWS

    BTC Vs. XRP: A former Ripple developer has shared an analysis suggesting that Strategy (formerly MicroStrategy), known for its Bitcoin-first investment approach, could have doubled its returns had it backed XRP instead of BTC. Ex-Ripple Developer Puts BTC vs XRP Strategy to the Test In a recent post on X, former Ripple developer Matt Hamilton

    The post MicroStrategy Would Be Up 2x If It Backed XRP Over BTC, Reveals Ex-Ripple Dev appeared first on CoinGape.

    Polymarket data has now placed the odds of full XRP ETF approval at 86% following the successful debut of the ProShares Ultra XRP ETF. XRP ETF Approval Odds Jump to 86% According to Polymarket data, the odds of an approval of the XRP ETF have now surged past 86%. This marks a 15% increase in

    The post XRP ETF Approval Odds Rise to 86% Following ProShares Launch Success appeared first on CoinGape.

    Analysts are once again predicting a new all-time high for the Pepe coin price amid Ethereum’s most recent surge. Pepe coin could soon emerge as this cycle’s breakout star thanks to growing whale activity and a growing holder base. PEPE Price Just a Step Away from New ATH In a recent video, popular analyst Jake

    The post Analyst Predicts Pepe Coin Price As ETH Breaks $3,600- All Time High Soon? appeared first on CoinGape.

    Join Tom as he covers key inflation data, earnings season highlights, and sector rotation trends. He breaks down recent price action in major indexes like the S&P 500 and Nasdaq, with a close look at the 20-day moving average as a support gauge. Tom spotlights standout industry groups such as gambling, semiconductors, software, and aerospace, and shares charts of top-performing stocks like Goldman Sachs, Johnson & Johnson, and PNC. Tom highlights under-performing areas like insurance brokers and home improvement, then reviews several strong earnings reactions, including Monarch Casino’s 15% after-hours gain.

    This video was published on July 17, 2025. Click this link to watch on Tom’s dedicated page.

    Missed a session? Archived videos from Tom are available at this link

    One great habit to develop as an investor is regularly scanning the stock market. Whether you’re checking for stocks that are outperforming a benchmark, gapping up, reversing, or breaking out of a trading range, scanning keeps you in the loop and, importantly, helps you stay sharp and spot potential opportunities early on. 

    During one of our routine scans, one stock stood out: Rigetti Computing, Inc. (RGTI), a company in a fast-moving quantum computing space. On Wednesday, RGTI closed the day up 30%, which turned some heads. What’s behind the move? Rigetti announced significant improvements in its platform, better performance metrics, and the 36-qubit system, a technical milestone in the quantum world.  

    Should You Invest in RGTI?

    If you ran any of the bullish predefined scans on StockCharts, you may have noticed RGTI popping up. That alone is a good reason to take a closer look at RGTI stock’s price action.

    Looking at the daily chart of RGTI, the stock had a nice ride in late 2024. However, things cooled off in early January 2025 and, since then, the stock has been trading sideways until this week. On Wednesday, RGTI gapped up with strong volume, breaking out of that sideways range.

    FIGURE 1. DAILY CHART OF RGTI STOCK. Since its rise in late 2024, the stock has been trading sideways until Wednesday, when it broke out of that range. Chart source: StockCharts.com. For educational purposes.

    Back in June, RGTI bounced off its 50-day simple moving average (SMA), which is starting to slope upward—a healthy technical signal. With Wednesday’s price move, RGTI is above its May 27 and July 8 highs.

    RGTI’s price isn’t too far from its all-time high, set in January. If the stock breaks above that level and has strong momentum, we could see it push to new highs. The Relative Strength Index (RSI) and Percentage Price Oscillator (PPO) are showing early signs of positive momentum.

    On the other hand, if the stock pulls back and Wednesday’s gap up doesn’t get filled, RGTI could reverse either at the May 27 or July 8 high. A reversal with a rise in momentum would confirm an upside continuation. If RGTI falls below these levels, fills Wednesday’s gap up, and finds support at the 50-day SMA, it could go back to trading sideways, waiting for the next catalyst. A decline below the 50-day SMA would invalidate the uptrend.

    A Rising Tide in Quantum Stocks?

    Other stocks in the Quantum Computing space, like IonQ, Inc. (IONQ) and D-Wave Quantum, Inc. (QBTS), also saw gains on Wednesday.

    Quantum computing stocks can be a bit of a roller coaster; they rallied at the end of 2024, dipped earlier this year, and are now gaining ground, thanks to encouraging news on quantum computing developments. The technology is in its early stages and could take years before it’s truly mainstream. So while these stocks are gaining attention now, the momentum may not be consistent.

    If you’re a long-term investor with patience and curiosity, it may be worth adding RGTI, QBTS, ION, and others to your ChartLists. Track them regularly and watch for continued technical strength or signs of trend reversals. 


    Disclaimer: This blog is for educational purposes only and should not be construed as financial advice. The ideas and strategies should never be used without first assessing your own personal and financial situation, or without consulting a financial professional.

    There is no denying that the broad markets remain in a resilient uptrend off the April 2025 low.  But if there’s one thing I’ve learned from many years of analyzing charts, it’s to remain vigilant during bullish phases.  Even though I’ll assume the uptrend is still intact, that doesn’t mean I can stop looking for signs of potential weakness!

    With that in mind, here are three bearish candle patterns that often pop up during bullish market phases.  By looking for these patterns in the stocks and ETFs that you own, you can hopefully get ahead of any corrective moves and take profits before it’s too late!

    The Shooting Star Pattern

    If you see a long upper shadow, little to no lower shadow, and the open and close are close together near the bottom of the day’s range, then you have identified a shooting star candle pattern.  If you’re familiar with the hammer candle pattern, then you can think of this as a hammer candle but basically everything is upside down!

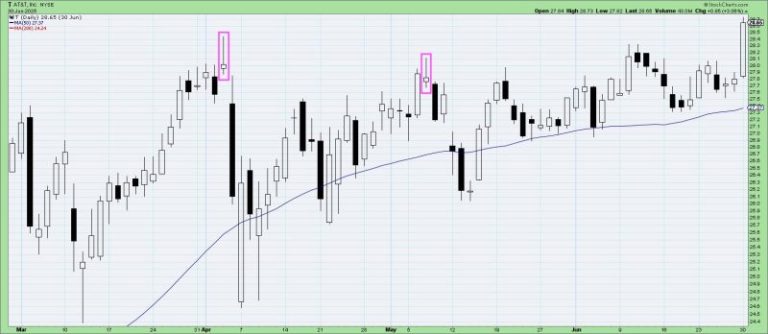
    The chart of AT&T (T) has featured a number of shooting star candles so far in 2025.  Just before the selloff in early April, there was a clear shooting star candle after the March rally.  Then during the rally off the April low, a shooting star pattern in early May suggested that the uptrend phase was nearing an exhaustion point.

    The Bearish Engulfing Pattern

    One of the most recognizable patterns in the candlestick library, the bearish engulfing pattern represents a short-term rotation from accumulation to distribution.  Basically, a large up candle is followed by a large down candle, and the second day’s “real body” (the open-to-close range) engulfs the range of the first day’s real body.  

    Look at the strength in the uptrend for Paramount Global (PARA) going into early June.  Then just before the 4th of July weekend, a bearish engulfing pattern suggests a change of character as the bears take control.  It’s worth noting that these candle patterns are not long-term signals, but rather indicate short-term dynamics.  So a bearish engulfing pattern suggests weakness for the next one to three bars.

    The Evening Star Pattern

    If you took the bearish engulfing pattern, and then added another small candle in the middle of those two days, then you’d have an evening star pattern.  Now most candlestick textbooks will tell you that the “star” day in the middle should include a gap, so there’s no overlap between that day’s range and the other two candles.  In practice, I’ve found most people ignore this detail and rather look for patterns with enough similarities to this basic structure.

    Going back to the AT&T chart we used earlier, we can see an evening star pattern at the end of June.  A big day is followed soon after by a big down day, with a small candle in the middle.  This is a great example of where additional weakness led the price below the 50-day moving average, serving to confirm the bearish outlook as represented by the evening star pattern.

    It’s so easy to become complacent during an extended bull market rally.  Investors that regularly scan for bearish candle patterns have an edge, as they can anticipate potential turning points before the uptrend changes in dramatic fashion to a new downtrend phase!

    RR#6,

    Dave

    PS- Ready to upgrade your investment process?  Check out my free behavioral investing course!

    David Keller, CMT

    President and Chief Strategist

    Sierra Alpha Research LLC

    marketmisbehavior.com

    https://www.youtube.com/c/MarketMisbehavior

    Disclaimer: This blog is for educational purposes only and should not be construed as financial advice.  The ideas and strategies should never be used without first assessing your own personal and financial situation, or without consulting a financial professional.  

    The author does not have a position in mentioned securities at the time of publication.    Any opinions expressed herein are solely those of the author and do not in any way represent the views or opinions of any other person or entity.

    The global transition to a green economy has been a boon for the cleantech market — it’s helping investment in renewable energy and clean technology continue to grow, allowing the sector to keep building momentum.

    Though cleantech’s long-term outlook is stable, the industry is facing challenges in Western markets as US policy shifts have sparked climate finance concerns. With US leadership on climate finance appearing to recede, there’s an opportunity for the Canadian market to take a leading role.

    As we enter the second half of 2025, here’s a look at the best-performing Canadian cleantech stocks on the TSX and TSXV year-to-date; CSE companies were considered, but none made the list at this time.

    Data for this article was gathered on July 14, 2025, using TradingView’s stock screener. Only companies with market capitalizations greater than C$50 million were considered.

    1. Tantalus Systems (TSX:GRID)

    Year-to-date gain: 76.32 percent
    Market cap: C$179.48 million
    Share price: C$3.35

    Tantalus Systems provides technology that gives utilities greater control and insight into their electric grids.

    This includes advanced metering infrastructure (AMI), load management systems and grid analytics, all of which contribute to a more efficient and reliable power grid.

    One of its key products, TRUConnect AMI, provides real-time data on energy consumption and grid conditions. The TRUFlex Load+DER Management system helps manage energy demand and integrate distributed energy resources like solar power, while TRUGrid Automation optimizes grid operations and improves response to events like power failures.

    On July 7, Tantalus announced that it was extending its partnership with EPB in Chattanooga, Tennessee, to deploy 20,000 TRUSense Ethernet Gateways over the next five years, integrating with EPB’s fiber network to enhance grid modernization and operational efficiency.

    2. Anaergia (TSX:ANRG)

    Year-to-date gain: 44.68 percent
    Market cap: C$229.36 million
    Share price: C$1.36

    Anaergia is a global company that specializes in converting waste, including wastewater and agricultural and municipal solid waste, into renewable energy, clean water and organic fertilizer.

    In July 2024, Anaeriga announced the completion of a strategic investment, saying it had closed the third tranche of a C$40.8 million investment deal with Marny Investissement that gave Marny a controlling interest of about 60 percent in Anaergia. The investment supported Anaergia’s strategic pivot to prioritizing capital-efficient growth and streamlined operations, with a greater focus on technology sales and operation and maintenance contracts.

    The company has operations in 17 countries spanning North America, Africa, Asia and Europe. So far in 2025, Anaergia has expanded its global reach through partnerships with companies in Italy and Spain, as well as through a partnership agreement to build a biogas facility in South Korea.

    3. CVW CleanTech (TSXV:CVW)

    Year-to-date gain: 18.82 percent
    Market cap: C$148.28 million
    Share price: C$1.01

    CVW CleanTech is focused on making the Canadian oil sands industry more sustainable.

    The company’s Creating Value from Waste (CVW) technology recovers bitumen and valuable minerals like titanium and zircon from oil sands tailings ponds, reducing the environmental impact of oil and gas production.

    In 2024, the company transitioned to a royalty-based model, investing in other cleantech companies in exchange for a share of their revenue. Its first royalty investment was in Northstar Clean Technologies (TSXV:ROOF,OTC:ROOOF), a company with technology that processes end-of-life asphalt shingles into components including liquid asphalt, as well as aggregate and fiber for industrial use. The deal was finalized in September.

    Now, the company is seeking shareholder approval to change its name to CVW Sustainable Royalties and switch its TSX Venture exchange listing from a technology issuer to an investment issuer, further solidifying its change in focus. However, it is still committed to commercializing its CVW technology.

    Securities Disclosure: I, Meagen Seatter, hold no direct investment interest in any company mentioned in this article.

    This post appeared first on investingnews.com