Author

admin

Browsing

As US President Donald Trump announced a 90-day tariff delay, top cryptocurrencies like Bitcoin (BTC), XRP, and Dogecoin (DOGE) are showing signs of a potential breakout. In addition, with Trump’s hint at pausing the 50% tariff on China, all eyes are on its potential impact on the broader crypto market.

With the traditional financial market experiencing relief after a massive downturn, cryptocurrencies, in correlation with stocks and bonds, are exhibiting positive momentum. Thus, Trump’s pause on his tariffs has sparked speculations of a bullish turn in BTC, XRP, and DOGE prices.

How Will Trump’s Tariff Delay Impact BTC, XRP, DOGE Prices?

Notably, Trump’s unexpected pause on his tariff plans has sparked anticipation of a bullish reversal in the crypto market. These speculations have been further boosted by the Bitcoin price’s recent rally past $94k, marking a significant market shift.

Other top cryptocurrencies like XRP and DOGE have also seen a bullish resurgence following Trump’s tariff delay. Considering the prevailing positive sentiment, analysts and traders remain optimistic about the future performance of BTC, XRP, and DOGE prices.

BTC Price to Hit $180K

Analyst CryptoELITES believe that the Bitcoin price is poised to hit a new all-time high of $180,000 in November 2025. At the same time, crypto expert Merlijn The Trader forecasted the BTC price’s bullish rally to $150k in the near future. Now, Bitcoin is exchanging hands at $94,386, up 1.9%.

Source: X, CryptoELITES

XRP Price Sets Sights at $50

In a recent analysis, expert XRP Governor has set a long-term target for the XRP price amid the latest Trump tariff delay. According to him, XRP could reach an ambitious high of $50 in 2027. Currently, XRP is valued at $2.20, up 2.29%.

DOGE Price Targets $0.22

Dogecoin, which is currently trading at $0.1821, has a short-term target of $0.22. Identifying a bull flag on its price chart, analysts predict DOGE’s potential uptrend.

Crypto Market Boost

Significantly, the crypto market is about to witness its highest rally, as pointed out by market expert Michael van de Poppe.

Source: X, Michael van de Poppe

Trump Views High Tariff as a Victory: Here’s Why

According to Donald Trump, high tariffs, 20%-50%, on foreign imports will be a “total victory” as the US will make a fortune from the revenue generated. In addition, these tariffs will attract companies to set up production in the US. This will create job opportunities and economic growth.

Furthermore, Trump draws comparisons to other countries like China, India, and Brazil to highlight their high tariffs. Thus, he acknowledges that tariffs are a key component of his economic policy.

In conclusion, this move has sparked speculation about a potential bullish rally in the crypto market, with Bitcoin being a key beneficiary.

The post BTC, XRP, DOGE Prices Eye Breakout As Trump Hints At Tariff Delay appeared first on CoinGape.

The fourth biggest cryptocurrency of the market, XRP, is up for a major milestone, as the Chicago Mercantile Exchange group (CME) is set to launch XRP futures on May 19, 2025. CME is the world’s largest derivative market, so this decision could bring a lot of opportunity for the altcoin, especially as the XRP price attempts recovery from the earlier crash. Before CME launches the futures, let’s discuss key details around it.

5 Not-to-Miss Things About CME Group XRP Futures

The official XRP futures launch is just days away, but the hype is rising even now. It is the first ever introduction of the Ripple token on one of the biggest traditional financial systems around the world.

Interestingly, these contracts are cash settled, which means that the users would not actually have to hold XRP. Instead, they would simply bet on the XRP price movement and settle the trade with normal currency (U.S. Dollar).

It will be in two different versions, allowing investors to choose according to their capabilities. One includes the standard CME group XRP futures (XRP), where the contract size is 50,000 XRP per contract. And the other is a Micro one (MXP), having 25,00 XRP per contract.

The latter one is more accessible for the smaller traders. Another thing to note is that the prices will be tracked on CME’s own XRP-Dollar Reference Rate, published at 4 p.m. daily, London time.

The Global Head of Crypto Products at CME, Giovanni Vicios, claims that this decision is made considering the rising institutional and retail demand for the Ripple token product. Recently, Teucrium launched a 2x XRP ETF. Even Robinhood is considering plans to introduce Ripple futures on its platform.

More importantly, this launch is part of the Chicago Mercantile Exchange group’s bigger plan, expanding into more altcoin derivatives.

Why is This CME Group XRP Future Launch a Big Deal?

CME launching Ripple tokens’ futures is the first ever listing of the cryptocurrency on the traditional financial market. However, this is just there’s more to it. The SEC has not approved the XRP ETF due to the regulatory issues with the asset.

Interestingly, experts like Hunt believe CME’s move could strengthen the case for XRP ETF approval, as its influence is huge.

Moreover, Paul Atkins is the new SEC Chairman after Senate approval. So, better events regarding regulatory clarity of the Ripple vs SEC, ETF, and the XRP price are anticipated.

At present, the token trades at $2.20, but investors await the Ripple price hitting $10 amid such bullish cases.

The post 5 Things to Know About XRP Futures Before CME Launches Them on May 19, 2025 appeared first on CoinGape.

If President Donald Trump’s 145% levy against imports from China holds, Hasbro estimates it could see as much as a $300 million hit to its bottom line.

The toy maker posted better-than-expected earnings on Thursday, but investors and analysts were more focused on the ongoing trade war Trump’s White House has waged against the toy industry’s biggest manufacturer.

Hasbro maintained the full-year guidance it issued last quarter, citing the uncertainty of the current tariff environment.

“Our forecast assumes various scenarios for China tariffs, ranging from 50% to the rate holding at 145% and 10% for the rest of world,” said Gina Goetter, chief financial officer and chief operating officer at Hasbro, during Thursday’s earnings call. “This translates to an estimated $100 million to $300 million gross impact across the enterprise in 2025. Before any mitigation.”

CEO Chris Cocks said during the company’s earnings call that “while no company is insulated, Hasbro is well positioned,” noting the company’s unchanged guidance is “supported by our robust games and licensing businesses and our strategic flexibility.”

“Prolonged tariff conditions create structural costs and heighten market unpredictability,” he said, adding, “ultimately tariffs translate into higher consumer prices.”

Cocks also warned of “potential job losses as we adjust to absorb increased costs and reduced profit for our shareholders.”

The company’s U.S. games business benefits from digital and domestic sourcing, as many of its board games are made in Massachusetts. Its Wizards of the Coast division, which includes Magic: The Gathering and Dungeons & Dragons, has a tariff exposure of less than $10 million, Cocks said, as much of the domestic product is made in North Carolina, Texas and Japan.

The company’s toy segment faces higher exposure, as a larger portion of those goods are made in China. Cocks said the company is exploring options for moving its supply chain to other countries.

“Some of that, though, comes with the cost,” he said. “When we manufacture board games in the U.S., it is significantly more expensive to manufacture here than it is in China.”

He added that the company can shift the sourcing of Play-Doh, for example, from China to its factory in Turkey. Under that scenario, Turkey manufacturers would redirect shipments from Europe to the U.S. and Chinese factories could fill in to supply the European market.

Other products are more difficult to triage, especially those that include electronics, high end deco and foam components, Cocks said.

“China will continue to be a major manufacturing hub for us globally, in large part due to specialized capabilities developed over decades,” he said.

Goetter said that much of the manufacturing changes would be seen in 2026 and are dependent on if those countries already have the capabilities and infrastructure in place to make certain products.

Hasbro is also accelerating its $1 billion cost savings plan in an effort to offset tariff pressures, but noted that price hikes are unavoidable.

“We are going to have to raise prices inside of 145% tariff regime with China,” Cocks said. “We’re just trying to do it as selectively as possible and minimize the burden to the fans and families that we serve.”

Both Goetter and Cocks admitted that Hasbro’s plans are flexible and will change as the tariff situation evolves. The company is hopeful for a “more predictable and favorable U.S. trade policy environment.”

“We’re trying to play both defense and offense at the same time,” Goetter said.

This post appeared first on NBC NEWS

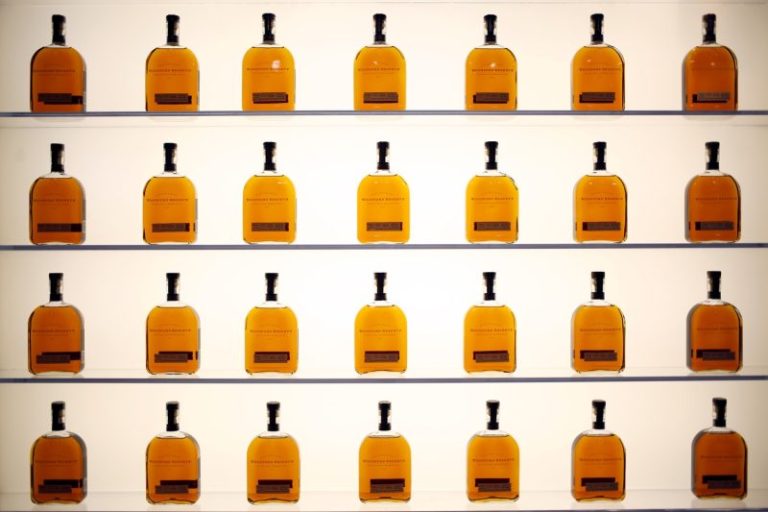
U.S. spirit exports reached a record $2.4 billion in 2024, driven in large part by tariff concerns and ongoing global trade disputes.

That is according to the American Spirits Exports report published by trade association the Distilled Spirits Council of the United States on Thursday.

“U.S. spirits exports hit a new high in 2024, recapturing lost market share since the UK and EU lifted retaliatory tariffs that were applied between 2018-2021,” said DISCUS President and CEO Chris Swonger. “Unfortunately, ongoing trade disputes unrelated to our sector have caused uncertainty, keeping many U.S. distillers on the sidelines and curtailing sales growth.”

U.S. spirits exports to the EU surged by 39%, fueled by concerns over the potential return of a 50% tariff on American whiskey imports in 2025, which was suspended in 2022.

In March, Trump threatened to put 200% tariffs on French Champagne and other EU spirits, which led European world leaders — specifically from Ireland, France and Italy — to advocate for bourbon tariffs not to return as part of retaliatory measures.

The threat of that specific tariff has faded somewhat as the U.S. and EU continue trade negotiations.

Approximately 50% of U.S. spirits were exported to the EU — totaling $1.2 billion — making it the largest export market.

Exports to the rest of the world, however, declined by nearly 10%, the report found, which reflects the broader softening alcohol category.

Suntory Beam, the Japanese maker of Jim Beam bourbon whiskey, said in December it was preparing for tariffs by stockpiling supply in Europe. The company is already heavily reliant on France and the United Kingdom, which make up over 50% of its global exports market over the last eight years, according to global trade data from Panjiva.

Several of the top states for exports in 2024 are significant bourbon economies, according to the report.

Still, American whiskey exports, which accounted for 54% of all U.S. spirits exports, dipped 5.4% to $1.3 billion.

Swonger said that while outlook for spirits remains highly unpredictable with ongoing trade disputes, one fact rings true in the data: Exports go to countries that have eliminated tariffs.

“We are thankful for President Trump’s early success in securing India’s reduction of its tariff on Bourbon from 150% to 100%,” Swonger said. “It’s our hope that the administration builds on this positive momentum by securing additional tariff reductions in India and reducing trade barriers in other countries.”

Headwinds remain for the industry. Canada, the second largest market for U.S. spirits exports, imposed a 25% tariff in on alcohol coming over the border in March, and several provinces have removed product from shelves.

Distiller and brewers also face steel and aluminum tariffs that impact materials costs for brewers like Constellation Brands, which lowered long-term 2027 and 2028 guidance significantly around “the anticipated impact of tariffs.”

This post appeared first on NBC NEWS

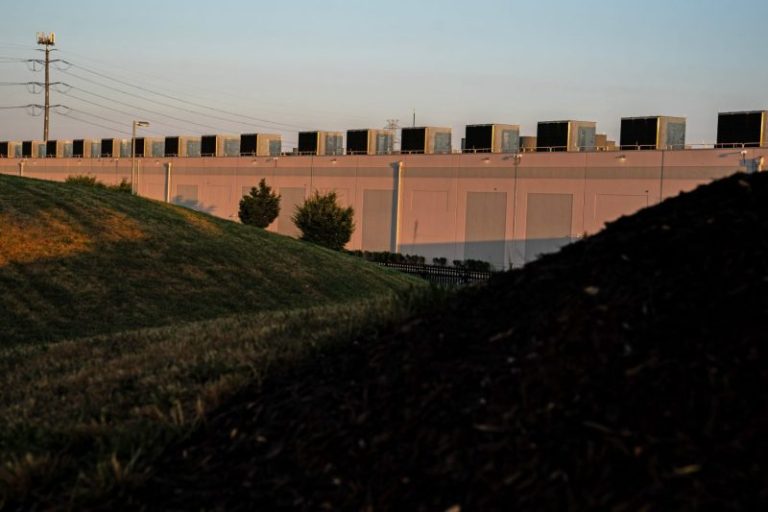
OKLAHOMA CITY — Amazon and Nvidia executives said Thursday that the construction of artificial intelligence data centers is not slowing down, as recession fears have some investors questioning whether tech companies will pull back on some of their plans.

“There’s been really no significant change,” Kevin Miller, Amazon’s vice president of global data centers, said at a conference organized by the Hamm Institute for American Energy. “We continue to see very strong demand, and we’re looking both in the next couple years as well as long term and seeing the numbers only going up.”

The comments run contrary to worrying buzz building on Wall Street about tech companies changing data center buildout plans. Wells Fargo analysts said Monday that Amazon Web Services is pausing some leases on data center commitments, citing industry sources. The magnitude of the pause was unclear, the analysts said, but the comments raised fears that Amazon was doing something similar to Microsoft’s recent move to pull back on some early stage projects.

Miller said “there’s been little tea leaf reading and extrapolating to strange results” about Amazon’s plans.

Nvidia is also not seeing signs of a slowdown, said Josh Parker, the chipmaker’s senior director of corporate sustainability.

“We haven’t seen a pullback,” Parker said. China’s artificial intelligence startup DeepSeek sparked a sell-off in power stocks earlier this year as investors worried that its artificial intelligence model is more efficient and data centers might need as much energy as originally anticipated.

But Parker said Nvidia sees computer and energy demand only rising due to AI, describing the reaction to DeepSeek as “kneejerk.” Anthropic co-founder Jack Clark said 50 gigawatts of new power capacity will be needed by 2027 to support AI. That is the equivalent of about 50 new nuclear plants.

“Anthropic and the other AI companies, what we’re seeing is tremendous growth in the need for new baseload power. We’re seeing unprecedented growth,” Clark said.

The executives were speaking at a gathering of tech and energy companies at a conference in Oklahoma City organized by the Hamm Institute to discuss how the U.S. can address the growing energy needs for AI. There is a growing consensus in both industries that natural gas will be needed to meet the power needs.

This post appeared first on NBC NEWS

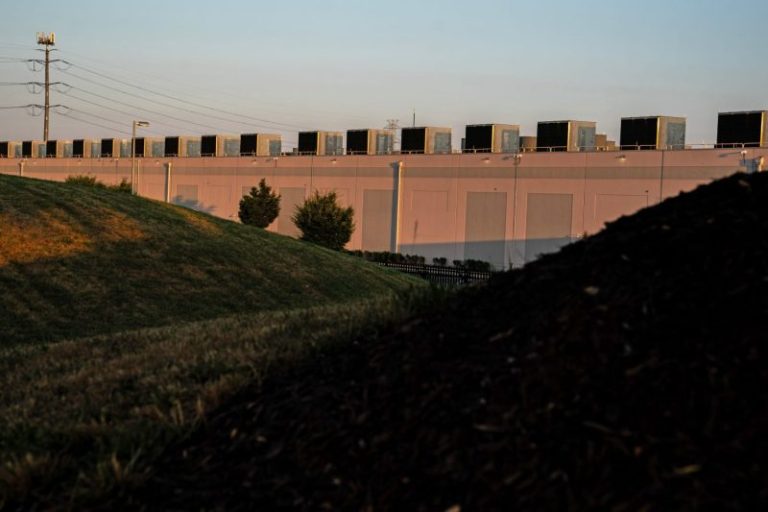
OKLAHOMA CITY — Amazon and Nvidia executives said Thursday that the construction of artificial intelligence data centers is not slowing down, as recession fears have some investors questioning whether tech companies will pull back on some of their plans.

“There’s been really no significant change,” Kevin Miller, Amazon’s vice president of global data centers, said at a conference organized by the Hamm Institute for American Energy. “We continue to see very strong demand, and we’re looking both in the next couple years as well as long term and seeing the numbers only going up.”

The comments run contrary to worrying buzz building on Wall Street about tech companies changing data center buildout plans. Wells Fargo analysts said Monday that Amazon Web Services is pausing some leases on data center commitments, citing industry sources. The magnitude of the pause was unclear, the analysts said, but the comments raised fears that Amazon was doing something similar to Microsoft’s recent move to pull back on some early stage projects.

Miller said “there’s been little tea leaf reading and extrapolating to strange results” about Amazon’s plans.

Nvidia is also not seeing signs of a slowdown, said Josh Parker, the chipmaker’s senior director of corporate sustainability.

“We haven’t seen a pullback,” Parker said. China’s artificial intelligence startup DeepSeek sparked a sell-off in power stocks earlier this year as investors worried that its artificial intelligence model is more efficient and data centers might need as much energy as originally anticipated.

But Parker said Nvidia sees compute and energy demand only rising due to AI, describing the reaction to DeepSeek as “kneejerk.” Anthropic co-founder Jack Clark said 50 gigawatts of new power capacity will be needed by 2027 to support AI. That is the equivalent of about 50 new nuclear plants.

“Anthropic and the other AI companies, what we’re seeing is tremendous growth in the need for new baseload power. We’re seeing unprecedented growth,” Clark said.

The executives were speaking at a gathering of tech and energy companies at a conference in Oklahoma City organized by the Hamm Institute to discuss how the U.S. can address the growing energy needs for AI. There is a growing consensus in both industries that natural gas will be needed to meet the power needs.

This post appeared first on NBC NEWS

When the stock market is turbulent, it makes sense to hedge some of your valuable equity positions. One way to do it is through options. 

The adage “Don’t keep all your eggs in one basket” is well-known among investors. While a diversified portfolio reduces your risk, you probably have a handful of favorite stocks that you don’t want to sell. But watching those stocks lose value can be painful.

The good news: There is a way to reduce your losses on those positions.

Hedging With Options

Before diving into the strategies, you need to determine what you want to do with the stocks you want to hold on to. When a market is trending lower, options help protect your investments in the following ways:

  • Protecting your stocks against losses.
  • Generating income from declining stock values. 
  • Realizing profits from declining stocks if the stock moves in your favor.

Before proceeding further, look at all your portfolio holdings and determine which stocks you want to hold on to, then determine your hedging objectives.

This article will focus on the strategies you can implement to protect your stocks against losses. You can do this by buying puts, which are similar to an insurance policy. You pay for downside protection to gain unlimited upside potential.

Here’s how it works.

  1. You buy one put contract for 100 shares of an underlying stock. For example, if you own 100 shares of Apple, Inc. (AAPL), you buy one AAPL put contract; if you own 200 shares of AAPL, you could buy 2 put contracts.
  2. You buy a put with a strike price that could generate a profit that you’re comfortable with on your equity position, and a premium (the price of the contract) that you’re willing to pay to protect your position.
  3. If the stock’s price falls below the strike price, you could sell your put contract for a profit.  You could also choose to exercise your put contract, i.e., selling the underlying shares at the contract’s strike price.

For example, say you bought 100 shares of AAPL for $110 per share. AAPL stock is trading slightly below $205 but hit a high of $259.81. You want to protect your unrealized gains in case the price falls further. Looking at the daily chart of AAPL below, further downside looks highly probable.

The 50-day simple moving average (SMA) has crossed below the 200-day, the StockCharts Technical Rank (SCTR) score is at 32.50, which is relatively low, and the relative strength index (RSI) just below 50, indicating neutral momentum.

FIGURE 1. DAILY CHART OF AAPL STOCK. A declining trend, a technically weak chart, and lukewarm momentum indicate a higher probability of further decline.Chart source: StockCharts.com. For educational purposes.

If you were to buy a put, what strike price and expiration would you choose? That can be a time-consuming exercise, but the OptionsPlay Add-on in StockCharts does it for you quickly. Here’s how.

  • Below the chart, click the Options menu, found under Tools & Resources. You’ll see the Options Chain by default (Options Summary).
  • Click the OptionsPlay button above the Options Chain to access the OptionsPlay Explorer. You’ll see the three optimal strategies listed.

FIGURE 2. OPTIMAL OPTIONS STRATEGIES FOR AAPL STOCK. You could sell 100 shares of AAPL, buy a put, or buy a put vertical spread. You can analyze the three scenarios and determine which one will help protect your equity position.Image source: StockCharts.com. For educational purposes.

The recommended long put (displayed in the middle) is the June 20 $205 put, which will cost $1,170. You have to decide if it’s worth paying this much premium to protect your position in the stock. If the stock price rises above $205 by expiration, your contract will expire worthless. You would have lost $1,170. Are you willing to take that risk?

You can modify the strategy by changing the expiration and strike price of the contract. This will help determine if there are more favorable risk-to-reward scenarios. The following scenarios could play out:

Scenario 1: The stock price falls below $205.

  • You could sell the put option for a profit, which will offset some of the unrealized losses from the decline in the stock’s price.
  • You could also choose to exercise the option and sell the shares for $205. You would walk away with a profit of $8,330 ($9,500 – 1,170).

Scenario 2: The stock price is above $205 by expiration.

  • Your put contract will expire worthless.
  • If you think the stock price will drop as contract expiration gets close, you could roll it to a further-out expiration. You’d sell your $205 June put and purchase another put option with a later expiration.

When buying puts, your maximum risk is limited to what you pay for the premium.

There’s More You Can Do

The strategy on the right shows a put vertical strategy, which has a much lower cost, a higher OptionsPlay score, and a potential reward of $2,145, which is much lower than buying a put.

The put vertical involves adding a lower strike price put with the same expiration. This would be a two-leg options trade—you buy the June 20 205 put and sell the June 20 $175 put.

The benefit of the put vertical is that you limit your risk to $855 (the debit). This will happen if  AAPL is above $205 and both puts expire worthless.

Your potential reward is limited to $2,145 (strike price – debit), which you will realize if AAPL’s stock price falls below $175. The probability of profit of the put vertical is 41.79%, versus 37.48% for the long put.

The Bottom Line

Buying puts and put vertical spreads can protect your options positions in a declining market. You still need to evaluate the cost of protection versus your profit potential, just as you would when you’re shopping for insurance.

The benefit of using the OptionsPlay Add-on is that the legwork is done for you. All you have to do is evaluate the different strategies, which are spelled out for you in simple terms. To learn more about the features available in the OptionsPlay Add-on, visit the StockCharts TV OptionsPlay with Tony Zhang YouTube channel.


Disclaimer: This blog is for educational purposes only and should not be construed as financial advice. The ideas and strategies should never be used without first assessing your personal and financial situation or without consulting a financial professional.

In this video, Joe highlights key technical setups in select country ETFs that are showing strength right now. He analyzes monthly and weekly MACD, ADX, and RSI trends that are signaling momentum shifts. Joe also reviews the critical level to watch on the S&P 500 (SPX), while breaking down important patterns in the QQQ, IWM, and Bitcoin. As always, he finishes with analysis on your most-requested stocks, applying his trusted multi-timeframe approach.

The video premiered on April 23, 2025. Click this link to watch on Joe’s dedicated page.

Archived videos from Joe are available at this link. Send symbol requests to stocktalk@stockcharts.com; you can also submit a request in the comments section below the video on YouTube. Symbol Requests can be sent in throughout the week prior to the next show.

Coelacanth Energy Inc. (TSXV: CEI) (‘Coelacanth’ or the ‘Company’) is pleased to announce its financial and operating results for the three months and year ended December 31, 2024. All dollar figures are Canadian dollars unless otherwise noted.

2024 HIGHLIGHTS

  • Drilled and completed three Lower Montney wells and completed a previously drilled Upper Montney well on its 5-19 pad at Two Rivers East. Average test production from the three Lower Montney wells was 1,624 boe/d (61% light oil) and test production from the Upper Montney well was 1,338 boe/d (54% light oil). (2)
  • Secured revolving bank credit facilities for a total of $52.0 million from a Canadian chartered bank.
  • Substantially completed construction of pipelines to connect the 5-19 pad wells to the Two Rivers East facility.
  • Initiated construction of its Two Rivers East facility for a Q2 2025 on-stream date.
FINANCIAL RESULTS Three Months Ended Year Ended
  December 31 December 31
($000s, except per share amounts)  2024  2023  % Change  2024  2023  % Change  
             
Oil and natural gas sales 4,544 4,204 8 13,736 6,663 106
             
Cash flow from (used in) operating activities 3,157 (404 ) (881 ) 2,203 (4,234 ) (152 )
Per share – basic and diluted (1) 0.01 (-) (100 ) (0.01 ) (100 )
             
Adjusted funds flow (used) (1) 382 1,750 (78 ) 1,515 (333 ) (555 )
Per share – basic and diluted (-) (-)
             
Net loss (2,903 ) (750 ) 287 (8,897 ) (6,573 ) 35
Per share – basic and diluted (0.01 ) (-) 100 (0.02 ) (0.01 ) 100
             
Capital expenditures (1) 64,952 34,656 87 84,497 74,613 13
             
Adjusted working capital (deficiency) (1)       (18,637 ) 67,589 (128 )
             
Common shares outstanding (000s)            
Weighted average – basic and diluted 530,398 478,731 11 529,804 439,055 21
             
End of period – basic       530,670 528,650
End of period – fully diluted       615,930 609,989 1  


(1) See ‘Non-GAAP and Other Financial Measures’ section.
(2) See ‘Test Results and Initial Production Rates’ section.

  Three Months Ended Year Ended
OPERATING RESULTS (1) December 31 December 31
   2024  2023  % Change  2024  2023  % Change  
             
Daily production (2)            
Oil and condensate (bbls/d) 473 419 13 320 139 130
Other NGLs (bbls/d) 29 28 4 34 16 113  
Oil and NGLs (bbls/d) 502 447 12 354 155 128
Natural gas (mcf/d) 3,490 2,858 22 3,648 1,624 125  
Oil equivalent (boe/d) 1,084 923 17 962 426 126
             
Oil and natural gas sales            
Oil and condensate ($/bbl) 87.06 87.38 (-) 89.46 88.94 1
Other NGLs ($/bbl) 33.28 32.32 3 33.22 33.22  
Oil and NGLs ($/bbl) 83.97 83.88 83.99 83.28 1
Natural gas ($/mcf) 2.07 2.86 (28 ) 2.14 3.26 (34 )
Oil equivalent ($/boe) 45.57 49.47 (8 ) 39.01 42.82 (9 )
             
Royalties            
Oil and NGLs ($/bbl) 16.86 19.38 (13 ) 18.70 20.24 (8 )
Natural gas ($/mcf) 0.13 0.26 (50 ) 0.21 0.57 (63 )
Oil equivalent ($/boe) 8.22 10.20 (19 ) 7.66 9.57 (20 )
             
Operating expenses            
Oil and NGLs ($/bbl) 8.34 11.57 (28 ) 9.47 13.25 (29 )
Natural gas ($/mcf) 1.25 1.28 (2 ) 1.58 2.21 (29 )
Oil equivalent ($/boe) 7.88 9.57 (18 ) 9.47 13.25 (29 )
             
Net transportation expenses (3)            
Oil and NGLs ($/bbl) 5.54 4.95 12 3.46 4.10 (16 )
Natural gas ($/mcf) 0.76 0.81 (6 ) 0.73 1.12 (35 )
Oil equivalent ($/boe) 5.01 4.92 2 4.04 5.75 (30 )
             
Operating netback (loss) (3)            
Oil and NGLs ($/bbl) 53.23 47.98 11 52.36 45.69 15
Natural gas ($/mcf) (0.07 ) 0.51 (114 ) (0.38 ) (0.64 ) (41 )
Oil equivalent ($/boe) 24.46 24.78 (1 ) 17.84 14.25 25
             
Depletion and depreciation ($/boe) (10.76 ) (12.18 ) (12 ) (13.59 ) (14.93 ) (9 )
General and administrative expenses ($/boe) (15.46 ) (10.77 ) 44 (14.34 ) (27.08 ) (47 )
Share based compensation ($/boe) (7.08 ) (16.31 ) (57 ) (11.12 ) (23.49 ) (53 )
Loss on lease termination ($/boe) (2.02 ) 100 (0.57 ) 100
Finance expense ($/boe) (18.02 ) (1.28 ) 1,308 (6.33 ) (3.09 ) 105
Finance income ($/boe) 3.65 10.01 (64 ) 8.23 18.75 (56 )
Unutilized transportation ($/boe) (3.88 ) (3.08 ) 26 (5.37 ) (6.65 ) (19 )
Net loss ($/boe) (29.11 ) (8.83 ) 230 (25.25 ) (42.24 ) (40 )


(1) See ‘Oil and Gas Terms’ section.
(2) See ‘Product Types’ section.
(3) See ‘Non-GAAP and Other Financial Measures’ section.

Selected financial and operational information outlined in this news release should be read in conjunction with Coelacanth’s audited financial statements and related Management’s Discussion and Analysis (‘MD&A’) for the year ended December 31, 2024, which are available for review under the Company’s profile on SEDAR+ at www.sedarplus.ca.

OPERATIONS UPDATE

In Q4 2024, Coelacanth achieved two more significant milestones in its vision of moving the Two Rivers Montney Project from a large Montney land block to a proven resource with decades of inventory.

In 2022 and 2023, Coelacanth was able to prove productivity in the Lower Montney over a significant portion of lands at Two Rivers that allowed for the decision to build-out infrastructure and to continue pad drilling at Two Rivers East. During 2024, Coelacanth completed the licensing phase of the infrastructure and started construction while also continuing to develop the Montney resource.

In Q4 2024, Coelacanth was able to substantially complete all pipelines required for its 5-19 pad that connected it from the pad to the future facility and then on to a midstream gathering system. Concurrently, Coelacanth completed a successful Upper Montney well at Two Rivers East and changed the completion design in the Lower Montney on the 5-19 pad. The Upper Montney completion proved significant productivity (previously announced test rate of 1,136 boe/d) (1) in a zone that can be mapped over a significant portion of Coelacanth’s lands and should materially increase drilling inventory. The new Lower Montney completions yielded increased overall test rates as well as increasing the oil percentage (3-well average test rates previously announced at 1,624 boe/d with 61% light oil) (1) pointing to potentially higher per-well recoveries of oil and gas and corresponding per-well values than previously estimated.

Construction of the facility continued throughout Q1 2025 and is now substantially complete. With 9 wells and over 11,000 boe/d (1) of test production waiting on completion of the facility, we anticipate yet another major milestone will be reached imminently. We look forward to reporting updates on the Two Rivers East project as new developments arise.

(1) See ‘Test Results and Initial Production Rates’ section for more details.

OIL AND GAS TERMS

The Company uses the following frequently recurring oil and gas industry terms in the news release:

Liquids
Bbls Barrels
Bbls/d Barrels per day
NGLs Natural gas liquids (includes condensate, pentane, butane, propane, and ethane)
Condensat Pentane and heavier hydrocarbons
   
Natural Gas
Mcf Thousands of cubic feet
Mcf/d Thousands of cubic feet per day
MMcf/d Millions of cubic feet per day
MMbtu Million of British thermal units
MMbtu/d Million of British thermal units per day
   
Oil Equivalent
Boe Barrels of oil equivalent
Boe/d Barrels of oil equivalent per day


Disclosure provided herein in respect of a boe may be misleading, particularly if used in isolation. A boe conversion rate of six thousand cubic feet of natural gas to one barrel of oil equivalent has been used for the calculation of boe amounts in the news release. This boe conversion rate is based on an energy equivalency conversion method primarily applicable at the burner tip and does not represent a value equivalency at the wellhead.

NON-GAAP AND OTHER FINANCIAL MEASURES

This news release refers to certain measures that are not determined in accordance with IFRS (or ‘GAAP’). These non-GAAP and other financial measures do not have any standardized meaning prescribed under IFRS and therefore may not be comparable to similar measures presented by other entities. The non-GAAP and other financial measures should not be considered alternatives to, or more meaningful than, financial measures that are determined in accordance with IFRS as indicators of the Company’s performance. Management believes that the presentation of these non-GAAP and other financial measures provides useful information to shareholders and investors in understanding and evaluating the Company’s ongoing operating performance, and the measures provide increased transparency to better analyze the Company’s performance against prior periods on a comparable basis.

Non-GAAP Financial Measures

Adjusted funds flow (used)
Management uses adjusted funds flow (used) to analyze performance and considers it a key measure as it demonstrates the Company’s ability to generate the cash necessary to fund future capital investments and abandonment obligations and to repay debt, if any. Adjusted funds flow (used) is a non-GAAP financial measure and has been defined by the Company as cash flow from (used in) operating activities excluding the change in non-cash working capital related to operating activities, movements in restricted cash deposits and expenditures on decommissioning obligations. Management believes the timing of collection, payment or incurrence of these items involves a high degree of discretion and as such may not be useful for evaluating the Company’s cash flows. Adjusted funds flow (used) is reconciled from cash flow from (used) in operating activities as follows:

  Three Months Ended Year Ended
  December 31 December 31
($000s)  2024  2023  2024  2023
Cash flow from (used in) operating activities  3,157 (404 ) 2,203 (4,234 )
Add (deduct):        
Decommissioning expenditures 161 206 1,427 1,883
Change in restricted cash deposits (5,361 ) (2,376 ) (784 )
Change in non-cash working capital 2,425 1,948 261 2,802  
Adjusted funds flow (used) (non-GAAP) 382 1,750 1,515 (333 )


Net transportation expenses
Management considers net transportation expenses an important measure as it demonstrates the cost of utilized transportation related to the Company’s production. Net transportation expenses is calculated as transportation expenses less unutilized transportation and is calculated as follows:

  Three Months Ended Year Ended
  December 31 December 31
($000s)  2024  2023  2024  2023  
Transportation expenses 887 680 3,313 1,930
Unutilized transportation (387 ) (262 ) (1,891 ) (1,035 )
Net transportation expenses (non-GAAP) 500 418 1,422 895


Operating netback
Management considers operating netback an important measure as it demonstrates its profitability relative to current commodity prices. Operating netback is calculated as oil and natural gas sales less royalties, operating expenses, and net transportation expenses and is calculated as follows:

  Three Months Ended Year Ended
  December 31 December 31
($000s)  2024  2023  2024  2023
Oil and natural gas sales 4,544 4,204 13,736 6,663
Royalties (820 ) (866 ) (2,698 ) (1,489 )
Operating expenses (786 ) (813 ) (3,335 ) (2,062 )
Net transportation expenses (500 ) (418 ) (1,422 ) (895 )
Operating netback (non-GAAP) 2,438 2,107 6,281 2,217


Capital expenditures
Coelacanth utilizes capital expenditures as a measure of capital investment on property, plant, and equipment, exploration and evaluation assets and property acquisitions compared to its annual budgeted capital expenditures. Capital expenditures are calculated as follows:

  Three Months Ended Year Ended
  December 31 December 31
($000s)  2024  2023  2024  2023
Capital expenditures – property, plant, and equipment 233 4,584 1,206 26,928
Capital expenditures – exploration and evaluation assets 64,719 30,072 83,291 47,685
Capital expenditures (non-GAAP) 64,952 34,656 84,497 74,613


Capital Management Measures

Adjusted working capital (deficiency)
Management uses adjusted working capital (deficiency) as a measure to assess the Company’s financial position. Adjusted working capital is calculated as current assets and restricted cash deposits less current liabilities, excluding the current portion of decommissioning obligations.

($000s)  December 31, 2024  December 31, 2023
Current assets 11,579 87,616
Less:     
Current liabilities  (37,234 ) (28,754 )
Working capital (deficiency)  (25,655 ) 58,862
Add:     
Restricted cash deposits 4,900 6,784
Current portion of decommissioning obligations 2,118 1,943
Adjusted working capital (deficiency) (Capital management measure) (18,637 ) 67,589


Non-GAAP Financial Ratios

Adjusted Funds Flow (Used) per share
Adjusted funds flow (used) per share is a non-GAAP financial ratio, calculated using adjusted funds flow (used) and the same weighted average basic and diluted shares used in calculating net loss per share.

Net transportation expenses per boe
The Company utilizes net transportation expenses per boe to assess the per unit cost of utilized transportation related to the Company’s production. Net transportation expenses per boe is calculated as net transportation expenses divided by total production for the applicable period.

Operating netback per boe
The Company utilizes operating netback per boe to assess the operating performance of its petroleum and natural gas assets on a per unit of production basis. Operating netback per boe is calculated as operating netback divided by total production for the applicable period.

Supplementary Financial Measures

The supplementary financial measures used in this news release (primarily average sales price per product type and certain per boe and per share figures) are either a per unit disclosure of a corresponding GAAP measure, or a component of a corresponding GAAP measure, presented in the financial statements. Supplementary financial measures that are disclosed on a per unit basis are calculated by dividing the aggregate GAAP measure (or component thereof) by the applicable unit for the period. Supplementary financial measures that are disclosed on a component basis of a corresponding GAAP measure are a granular representation of a financial statement line item and are determined in accordance with GAAP.

PRODUCT TYPES

The Company uses the following references to sales volumes in the news release:

Natural gas refers to shale gas.
Oil and condensate refers to condensate and tight oil combined.
Other NGLs refers to butane, propane and ethane combined.
Oil and NGLs refers to tight oil and NGLs combined.
Oil equivalent refers to the total oil equivalent of shale gas, tight oil, and NGLs combined, using the conversion rate of six thousand cubic feet of shale gas to one barrel of oil equivalent as described above.

The following is a complete breakdown of sales volumes for applicable periods by specific product types of shale gas, tight oil, and NGLs:

  Three Months Ended Year Ended
  December 31 December 31
Sales Volumes by Product Type  2024  2023 2024  2023
         
Condensate (bbls/d) 22 12 32 7
Other NGLs (bbls/d) 29 28 35 16
NGLs (bbls/d) 51 40 67 23
         
Tight oil (bbls/d) 451 407 287 132
Condensate (bbls/d) 22 12 32 7
Oil and condensate (bbls/d) 473 419 319 139
Other NGLs (bbls/d) 29 28 35 16
Oil and NGLs (bbls/d) 502 447 354 155
         
Shale gas (mcf/d) 3,490 2,858 3,648 1,624
Natural gas (mcf/d) 3,490 2,858 3,648 1,624
         
Oil equivalent (boe/d) 1,084 923 962 426


TEST RESULTS AND INITIAL PRODUCTION RATES

The 5-19 Lower Montney well was production tested for 9.4 days and produced at an average rate of 377 bbl/d oil and 2,202 mcf/d gas (net of load fluid and energizing fluid) over that period which includes the initial cleanup where only load water was being recovered. At the end of the test, flowing wellhead pressure and production rates were stable.

The A5-19 Basal Montney well was production tested for 5.9 days and produced at an average rate of 117 bbl/d oil and 630 mcf/d gas (net of load fluid and energizing fluid) over that period which includes the initial cleanup where only load water was being recovered. At the end of the test, flowing wellhead pressure and production rates were stable.

The B5-19 Upper Montney well was production tested for 6.3 days and produced at an average rate of 92 bbl/d oil and 2,100 mcf/d gas (net of load fluid and energizing fluid) over that period which includes the initial cleanup where only load water was being recovered. At the end of the test, flowing wellhead pressure and production rates were stable.

The C5-19 Lower Montney well was production tested for 5.8 days and produced at an average rate of 736 bbl/d oil and 2,660 mcf/d gas (net of load fluid and energizing fluid) over that period which includes the initial cleanup where only load water was being recovered. At the end of the test, flowing wellhead pressure and production rates were stable.

The D5-19 Lower Montney well was production tested for 12.6 days and produced at an average rate of 170 bbl/d oil and 580 mcf/d gas (net of load fluid and energizing fluid) over that period which includes the initial cleanup where only load water was being recovered. At the end of the test, flowing wellhead pressure and production rates were stable.

The E5-19 Lower Montney well was production tested for 11.4 days and produced at an average rate of 312 bbl/d oil and 890 mcf/d gas (net of load fluid and energizing fluid) over that period which includes the initial cleanup where only load water was being recovered. At the end of the test, flowing wellhead pressure was stable, and production was starting to decline.

The F5-19 Lower Montney well was production tested for 4.9 days and produced at an average rate of 728 bbl/d oil and 1,607 mcf/d gas (net of load fluid and energizing fluid) over that period which includes the initial cleanup where only load water was being recovered. At the end of the test, flowing wellhead pressure and production rates were stable.

The G5-19 Lower Montney well was production tested for 7.1 days and produced at an average rate of 415 bbl/d oil and 1,489 mcf/d gas (net of load fluid and energizing fluid) over that period which includes the initial cleanup where only load water was being recovered. At the end of the test, flowing wellhead pressure and production rates were stable.

The H5-19 Lower Montney well was production tested for 8.1 days and produced at an average rate of 411 bbl/d oil and 1,166 mcf/d gas (net of load fluid and energizing fluid) over that period which includes the initial cleanup where only load water was being recovered. At the end of the test, flowing wellhead pressure was stable and production was starting to decline.

A pressure transient analysis or well-test interpretation has not been carried out on these nine wells and thus certain of the test results provided herein should be considered to be preliminary until such analysis or interpretation has been completed. Test results and initial production rates disclosed herein, particularly those short in duration, may not necessarily be indicative of long-term performance or of ultimate recovery.

Any references to peak rates, test rates, IP30, IP90, IP180 or initial production rates or declines are useful for confirming the presence of hydrocarbons, however, such rates and declines are not determinative of the rates at which such wells will continue production and decline thereafter and are not indicative of long-term performance or ultimate recovery. IP30 is defined as an average production rate over 30 consecutive days, IP90 is defined as an average production rate over 90 consecutive days and IP180 is defined as an average production rate over 180 consecutive days. Readers are cautioned not to place reliance on such rates in calculating aggregate production for the Company.

FORWARD-LOOKING INFORMATION

This document contains forward-looking statements and forward-looking information within the meaning of applicable securities laws. The use of any of the words ‘expect’, ‘anticipate’, ‘continue’, ‘estimate’, ‘may’, ‘will’, ‘should’, ‘believe’, ‘intends’, ‘forecast’, ‘plans’, ‘guidance’ and similar expressions are intended to identify forward-looking statements or information.

More particularly and without limitation, this news release contains forward-looking statements and information relating to the Company’s oil and condensate, other NGLs, and natural gas production, capital programs, and adjusted working capital (deficiency). The forward-looking statements and information are based on certain key expectations and assumptions made by the Company, including expectations and assumptions relating to prevailing commodity prices and exchange rates, applicable royalty rates and tax laws, future well production rates, the performance of existing wells, the success of drilling new wells, the availability of capital to undertake planned activities, and the availability and cost of labour and services.

Although the Company believes that the expectations reflected in such forward-looking statements and information are reasonable, it can give no assurance that such expectations will prove to be correct. Since forward-looking statements and information address future events and conditions, by their very nature they involve inherent risks and uncertainties. Actual results may differ materially from those currently anticipated due to a number of factors and risks. These include, but are not limited to, the risks associated with the oil and gas industry in general such as operational risks in development, exploration and production, delays or changes in plans with respect to exploration or development projects or capital expenditures, the uncertainty of estimates and projections relating to production rates, costs, and expenses, commodity price and exchange rate fluctuations, marketing and transportation, environmental risks, competition, the ability to access sufficient capital from internal and external sources and changes in tax, royalty, and environmental legislation. The forward-looking statements and information contained in this document are made as of the date hereof for the purpose of providing the readers with the Company’s expectations for the coming year. The forward-looking statements and information may not be appropriate for other purposes. The Company undertakes no obligation to update publicly or revise any forward-looking statements or information, whether as a result of new information, future events or otherwise, unless so required by applicable securities laws.

Coelacanth is an oil and natural gas company, actively engaged in the acquisition, development, exploration, and production of oil and natural gas reserves in northeastern British Columbia, Canada.

Further Information

For additional information, please contact:

Coelacanth Energy Inc.
Suite 2110, 530 – 8th Avenue SW
Calgary, Alberta T2P 3S8
Phone: (403) 705-4525
www.coelacanth.ca

Mr. Robert J. Zakresky
President and Chief Executive Officer

Mr. Nolan Chicoine
Vice President, Finance and Chief Financial Officer

Neither the TSX Venture Exchange nor its Regulation Services Provider (as that term is defined in the policies of the TSX Venture Exchange) accepts responsibility for the adequacy or accuracy of this release.

To view the source version of this press release, please visit https://www.newsfilecorp.com/release/249584

News Provided by Newsfile via QuoteMedia

This post appeared first on investingnews.com

Coelacanth Energy Inc. (TSXV: CEI) (‘Coelacanth’ or the ‘Company’) is pleased to announce its 2024 year-end reserves as independently evaluated by GLJ Ltd. (‘GLJ’) effective December 31, 2024 (the ‘GLJ Report’ or the ‘Report’), in accordance with National Instrument 51-101 (‘NI 51-101’) and the Canadian Oil and Gas Evaluation (‘COGE’) Handbook. All dollar figures are Canadian dollars unless otherwise noted.

Introduction

During 2024, Coelacanth drilled an additional 3 Lower Montney wells on its 5-19 pad and started the construction of pipelines and facilities to allow for the production of all 9 wells on the 5-19 pad to come on production in Q2 2025. The 9 wells consist of 7 Lower Montney wells, 1 Upper Montney well and 1 Basal Montney well that have tested over 11,000 boe/d (flush production) (1). On completion of phase 1 of the facility in May 2025, Coelacanth will have capacity to produce 30.0 mmcf/d of gas plus the concurrent oil production for a combined capacity of approximately 7,500-8,000 boe/d. Phase 2 (adding compression) is scheduled for Q4 2025 and will double capacity.

Coelacanth almost doubled its reserves from 2023 while still only having recognized reserves on less than 10% of its 150 section Montney land block at Two Rivers. A total of 23 combined wells and locations are included in the Report comprised of 13 drilled and completed Montney wells plus 10 Montney undeveloped locations. The 13 existing wells include 8 Lower Montney wells, 4 Upper Montney wells, and 1 Basal Montney well. All 10 undeveloped locations booked were Lower Montney leaving potential to book additional Upper and Basal Montney wells on the same lands. Coelacanth believes it has been conservative in its bookings and, over time, will be able to expand the current reserve base to cover a greater portion of the land base.

The Report includes a total of $148.3 million of future development capital (‘FDC’) of which $33.5 million is in Jan-May of 2025 for phase 1 of the facility. By the end of May, the capital for phase 1 of the facility will have been spent and all of the proved developed non-producing and probable developed non-producing reserves will change to producing status. These adjustments will have a material effect on the Report given the FDC for phase 1 of the facility will be removed (thereby increasing the overall value) and the producing portion of the Report will increase dramatically with wells coming on production. Coelacanth is planning to engage GLJ to provide a mid-year update of the Report to better illustrate the magnitude of the changes.

Coelacanth’s business plan for the Two Rivers Montney Project includes:

  • Delineating and establishing production on multiple Montney zones over its extensive land base.
  • Accelerating production through pad drilling once initial infrastructure is complete.
  • Licensing and constructing additional facilities and pipelines to process future production additions.

Coelacanth is currently:

  • Finalizing the construction of Two Rivers East facility to accommodate the 5-19 pad production.
  • Licensing additional pads for future development.
  • Completing a third-party resource study to aid in well spacing and completion design as well as future delineation.
  • Completing a detailed review of Two Rivers for well development and future infrastructure requirements.

Coelacanth is excited to initiate its business plan to systematically develop the property, establish the ultimate reserve recoveries and move the established recoverable resource from land to its established producing reserve base.

Reserve Highlights

Coelacanth is pleased to report material increases in both reserves and value:

  • Increased Total Proved plus Probable reserves by 95% to 27.5 million boe from 14.1 million boe.
  • Increased Total Proved reserves by 63% to 17.1 million boe from 10.5 million boe.
  • Increased Total Proved plus Probable Reserve value (net present value before taxes, discounted at 10%) by 155% to $239.6 million from $93.9 million.

Notes:
(1) See ‘Test Results and Initial Production Rates’.

Reserves Summary

Coelacanth’s December 31, 2024 reserves as prepared by GLJ effective December 31, 2024 and based on the GLJ (2025-01) future price forecast are as follows: (1,4)

Working Interest Reserves (2) Tight Oil
(Mbbl)
Shale
Natural Gas
(Mmcf)
NGLs
(Mbbl)
Total Oil Equivalent
(Mboe) (3)
Proved
Producing 344 8,097 150 1,843
Developed non-producing 1,874 38,862 720 9,071
Undeveloped 1,137 27,324 506 6,197
Total proved 3,355 74,283 1,376 17,111
Probable 2,154 44,543 825 10,403
Total proved & probable 5,509 118,826 2,201 27,515


Notes:
(1) Numbers may not add due to rounding.
(2) ‘Working Interest’ or ‘Gross’ reserves means Coelacanth’s working interest (operating and non-operating) share before deduction of royalties and without including any royalty interest of Coelacanth.
(3) Oil equivalent amounts have been calculated using a conversion rate of six thousand cubic feet of natural gas to one barrel of oil.
(4) Disclosure of Net reserves are included in Company’s Annual Information Form (‘AIF’) dated April 23, 2025 filed on SEDAR+ at www.sedarplus.ca. ‘Net’ reserves means Coelacanth’s working interest (operated and non-operated) share after deduction of royalties, plus Coelacanth’s royalty interest in reserves.

Reserves Values

The estimated future net revenues before taxes associated with Coelacanth’s reserves effective December 31, 2024 and based on the GLJ (2025-01) future price forecast are summarized in the following table: (1,2,3,4)

Discount factor per year
($000s) 0% 5% 10% 15% 20%
Proved
Producing 21,615 17,655 14,827 12,765 11,220
Developed non-producing 131,346 97,179 74,105 57,825 45,878
Undeveloped 93,068 63,389 44,903 32,689 24,196
Total proved 246,030 178,224 133,834 103,279 81,294
Probable 221,362 147,285 105,806 80,431 63,701
Total proved & probable 467,391 325,509 239,640 183,710 144,995


Notes:
(1) Numbers may not add due to rounding.
(2) The estimated future net revenues are stated prior to provision for interest, debt service charges or general administrative expenses and after deduction of royalties, operating costs, estimated well abandonment and reclamation costs and estimated future capital expenditures.
(3) The estimated future net revenue contained in the table does not necessarily represent the fair market value of the reserves. There is no assurance that the forecast price and cost assumptions contained in the GLJ Report will be attained and variations could be material. The recovery and reserve estimates described herein are estimates only. Actual reserves may be greater or less than those calculated.
(4) The after-tax present values of future net revenue attributed to Coelacanth’s reserves are included in Company’s AIF dated April 23, 2025 filed on SEDAR+ at www.sedarplus.ca.

Price Forecast

The GLJ (2025-01) price forecast is as follows:

Year WTI Oil @ Cushing
($US / Bbl)
Edmonton Light Oil
($Cdn / Bbl)
AECO Natural Gas
($Cdn / Mmbtu)
Chicago Natural Gas
($US / Mmbtu)
Foreign Exchange
(Cdn$/US$)
2025 71.25 91.33 2.05 2.79 0.7050
2026 73.50 93.32 3.00 3.70 0.7300
2027 76.00 96.45 3.50 4.01 0.7500
2028 78.53 99.82 4.00 4.10 0.7500
2029 80.10 101.80 4.08 4.18 0.7500
2030 81.70 103.84 4.16 4.27 0.7500
2031 83.34 105.92 4.24 4.35 0.7500
2032 85.00 108.04 4.33 4.45 0.7500
2033 86.70 110.20 4.41 4.54 0.7500
2034 88.44 112.40 4.50 4.63 0.7500
Escalate thereafter (1) 2.0% per year 2.0% per year 2.0% per year 2.0% per year


Note:
(1) Escalated at two per cent per year starting in 2034 in the January 1, 2025 GLJ price forecast with the exception of foreign exchange, which remains flat.

Reserve Life Index (‘RLI’)

Coelacanth’s RLI presented below is based on estimated Q4 2024 average production of 1,084 boe per day.

Reserve Category RLI
Proved plus Probable Reserves 69.0
Proved Reserves 42.9


Reserves Reconciliation

The following summary reconciliation of Coelacanth’s working interest reserves compares changes in the Company’s reserves as at December 31, 2024 to the reserves as at December 31, 2023 based on the GLJ (2025-01) future price forecast: (1,2)

Total Proved Tight Oil  Shale
Natural Gas 
NGLs  Total Oil
Equivalent
  (Mbbl) (Mmcf)  (Mbbl) (Mboe) (3)
Opening balance          2,291       44,784         720       10,475
Discoveries                       –                    –                          –                  –
Extensions and improved recovery            1,212              27,468                 509          6,298
Technical revisions                 (28)             3,663              173         756
Acquisitions               –                  –                         –                    –
Dispositions                    –                    –                            –                           –
Economic factors              (15)            (297)               (1)              (66)
Production                    (105)            (1,335)                (24)           (352)
Closing balance           3,355               74,283           1,376           17,111
         
         
Proved plus Probable Tight Oil Shale
Natural Gas
NGLs Total Oil
Equivalent
  (Mbbl) (Mmcf) (Mbbl) (Mboe) (3)
Opening balance            3,038      60,432                970            14,080
Discoveries                 –                     –             –                       –
Extensions and improved recovery            2,599               56,330              1,043         13,031
Technical revisions               (9)              3,734                 213                     825
Acquisitions                      –               –                 –                      –
Dispositions                      –                         –         –                   –
Economic factors             (13)              (334)                       –             (69)
Production            (105)         (1,335)                   (24)          (352)
Closing balance       5,509         118,826          2,201         27,515​


Notes:
(1) Numbers may not add due to rounding.
(2) ‘Working Interest’ or ‘Gross’ reserves means Coelacanth’s working interest (operating and non-operating) share before deduction of royalties and without including any royalty interest of Coelacanth.
(3) Oil equivalent amounts have been calculated using a conversion rate of six thousand cubic feet of natural gas to one barrel of oil.

Capital Expenditures

Capital allocation by category is as follows:

       
($000s) 2024 2023 2022
Undeveloped land                   765                  1,006          1,164
Acquisitions             765            1,006              1,164
       
Drilling and completion            38,353           61,274              9,009
Facilities and related infrastructure            44,935          12,094         3,689
Geological, geophysical  and other             444             239              42
Exploration and development expenditures          83,732          73,607              12,740
       
Total capital expenditures    84,497   74,613      13,904


Finding and Development Costs (‘F&D’) and Finding, Development and Acquisition Costs (‘FD&A’)

Coelacanth has presented FD&A and F&D costs below:

   2024   2023  2022  3 Year Cumulative 
     Proved &
   Proved &    Proved &    Proved &
($000’s, except where noted)  Proved  Probable  Proved  Probable  Proved  Probable  Proved  Probable
                 
                 
Exploration and development expenditures      83,732      83,732      73,607      73,607      12,740      12,740   170,079   170,079
Change in FDC (1)      (1,713)      30,469      90,598      77,759      11,400      33,748   100,285   141,976
F&D costs       82,019   114,201   164,205   151,366      24,140      46,488   270,364   312,055
Acquisitions           765           765        1,006        1,006        1,164        1,164        2,935        2,935
FD&A costs       82,784   114,966   165,211   152,372      25,304      47,652   273,299   314,990
                 
Reserve Additions (Mboe) (2)                
Exploration and development        6,989      13,789        8,637        9,784        1,169        3,400      16,795      26,973
Acquisitions                 –                 –                 –                 –                 –                 –                 –                 –
         6,989      13,789        8,637        9,784        1,169        3,400      16,795      26,973
                 
F&D costs ($/boe)        11.74          8.28        19.01        15.47        20.65        13.67        16.10        11.57
FD&A costs ($/boe)        11.84          8.34        19.13        15.57        21.65        14.02        16.27        11.68


Notes:
(1) Future development capital (‘FDC’) expenditures required to recover reserves estimated by GLJ. The aggregate of the exploration and development costs incurred in the most recent financial period and the change during that period in estimated future development costs generally may not reflect total finding and development costs related to reserve additions for that period.
(2) Sum of extensions and improved recovery, technical revisions and economic factors in the reserves reconciliation included above.

For Coelacanth’s full NI 51-101 disclosure related to its 2024 year-end reserves please refer to the Company’s AIF dated April 23, 2025 filed on SEDAR+ at www.sedarplus.ca.

Forward-Looking Information

This news release contains forward-looking statements and forward-looking information within the meaning of applicable securities laws. The use of any of the words ‘expect’, ‘anticipate’, ‘continue’, ‘estimate’, ‘may’, ‘will’, ‘should’, ‘believe’, ‘intends’, ‘forecast’, ‘plans’, ‘guidance’ and similar expressions are intended to identify forward-looking statements or information.

More particularly and without limitation, this document contains forward-looking statements and information relating to the Company’s oil, NGLs and natural gas production and reserves and reserves values, capital programs, and oil, NGLs, and natural gas commodity prices. The forward-looking statements and information are based on certain key expectations and assumptions made by the Company, including expectations and assumptions relating to prevailing commodity prices and exchange rates, applicable royalty rates and tax laws, future well production rates, the performance of existing wells, the success of drilling new wells, the availability of capital to undertake planned activities and the availability and cost of labor and services.

Although the Company believes that the expectations reflected in such forward-looking statements and information are reasonable, it can give no assurance that such expectations will prove to be correct. Since forward-looking statements and information address future events and conditions, by their very nature they involve inherent risks and uncertainties. Actual results may differ materially from those currently anticipated due to a number of factors and risks. These include, but are not limited to, the risks associated with the oil and gas industry in general such as operational risks in development, exploration and production, delays or changes in plans with respect to exploration or development projects or capital expenditures, the uncertainty of estimates and projections relating to production rates, costs and expenses, commodity price and exchange rate fluctuations, marketing and transportation, environmental risks, competition, the ability to access sufficient capital from internal and external sources and changes in tax, royalty and environmental legislation. The forward-looking statements and information contained in this document are made as of the date hereof for the purpose of providing the readers with the Company’s expectations for the coming year. The forward-looking statements and information may not be appropriate for other purposes. The Company undertakes no obligation to update publicly or revise any forward-looking statements or information, whether as a result of new information, future events or otherwise, unless so required by applicable securities laws.

Reserves Data

There are numerous uncertainties inherent in estimating quantities of tight oil, shale gas, and NGLs reserves and the future cash flows attributed to such reserves. The reserve and associated cash flow information set forth above are estimates only. In general, estimates of economically recoverable tight oil, shale gas, and NGLs reserves and the future net cash flows therefrom are based upon a number of variable factors and assumptions, such as historical production from the properties, production rates, ultimate reserve recovery, timing and amount of capital expenditures, marketability of oil and natural gas, royalty rates, the assumed effects of regulation by governmental agencies and future operating costs, all of which may vary materially.

Individual properties may not reflect the same confidence level as estimates of reserves for all properties due to the effects of aggregation.

This news release contains estimates of the net present value of the Company’s future net revenue from its reserves. Such amounts do not represent the fair market value of the Company’s reserves.

The reserves data contained in this news release has been prepared in accordance with National Instrument 51-101 (‘NI 51-101’). The reserve data provided in this news release presents only a portion of the disclosure required under NI 51-101. All of the required information will be contained in the Company’s Annual Information Form for the year ended December 31, 2024, filed on SEDAR+ at www.sedarplus.ca.

Reserves are estimated remaining quantities of oil and natural gas and related substances anticipated to be recoverable from known accumulations, as of a given date, based on the analysis of drilling, geological, geophysical and engineering data; the use of established technology, and specified economic conditions, which are generally accepted as being reasonable. Reserves are classified according to the degree of certainty associated with the estimates as follows:

  • Proved Reserves are those reserves that can be estimated with a high degree of certainty to be recoverable. It is likely that the actual remaining quantities recovered will exceed the estimated proved reserves.

  • Probable Reserves are those additional reserves that are less certain to be recovered than proved reserves. It is equally likely that the actual remaining quantities recovered will be greater or less than the sum of the estimated proved plus probable reserves.

Industry Metrics

This news release contains metrics commonly used in the oil and natural gas industry. Each of these metrics is determined by the Company as set out below or elsewhere in this news release. These metrics are ‘F&D costs’, ‘FD&A costs’, and ‘reserve-life index’. These metrics do not have standardized meanings and may not be comparable to similar measures presented by other companies. As such, they should not be used to make comparisons.

Management uses these oil and gas metrics for its own performance measurements and to provide shareholders with measures to compare the Company’s performance over time, however, such measures are not reliable indicators of the Company’s future performance and future performance may not compare to the performance in previous periods.

‘F&D costs’ are calculated by dividing the sum of the total capital expenditures for the year (in dollars) by the change in reserves within the applicable reserves category (in boe). F&D costs, including FDC, includes all capital expenditures in the year as well as the change in FDC required to bring the reserves within the specified reserves category on production.

‘FD&A costs’ are calculated by dividing the sum of the total capital expenditures for the year inclusive of the net acquisition costs and disposition proceeds (in dollars) by the change in reserves within the applicable reserves category inclusive of changes due to acquisitions and dispositions (in boe). FD&A costs, including FDC, includes all capital expenditures in the year inclusive of the net acquisition costs and disposition proceeds as well as the change in FDC required to bring the reserves within the specified reserves category on production.

The Company uses F&D and FD&A as a measure of the efficiency of its overall capital program including the effect of acquisitions and dispositions. The aggregate of the exploration and development costs incurred in the most recent financial year and the change during that year in estimated future development costs generally will not reflect total finding and development costs related to reserves additions for that year.

‘Reserve life index’ or ‘RLI’ is calculated by dividing the reserves (in boe) in the referenced category by the latest quarter of production (in boe) annualized. The Company uses this measure to determine how long the booked reserves will last at current production rates if no further reserves were added.

BOE Conversions

BOE’s may be misleading, particularly if used in isolation. A BOE conversion ratio of 6 Mcf: 1 Bbl is based on an energy equivalency conversion method primarily applicable at the burner tip and does not represent a value equivalency at the wellhead.

Abbreviations

Bbl barrel
Mbbl thousands of barrels
MMbtu millions of British thermal units
Mcf thousand cubic feet
MMcf million cubic feet
NGLs natural gas liquids
BOE barrel of oil equivalent
MBOE thousands of barrels of oil equivalent
WTI West Texas Intermediate at Cushing, Oklahoma


Test Results and Initial Production Rates

The 5-19 Lower Montney well was production tested for 9.4 days and produced at an average rate of 377 bbl/d oil and 2,202 mcf/d gas (net of load fluid and energizing fluid) over that period which includes the initial cleanup where only load water was being recovered. At the end of the test, flowing wellhead pressure and production rates were stable.

The A5-19 Basal Montney well was production tested for 5.9 days and produced at an average rate of 117 bbl/d oil and 630 mcf/d gas (net of load fluid and energizing fluid) over that period which includes the initial cleanup where only load water was being recovered. At the end of the test, flowing wellhead pressure and production rates were stable.

The B5-19 Upper Montney well was production tested for 6.3 days and produced at an average rate of 92 bbl/d oil and 2,100 mcf/d gas (net of load fluid and energizing fluid) over that period which includes the initial cleanup where only load water was being recovered. At the end of the test, flowing wellhead pressure and production rates were stable.

The C5-19 Lower Montney well was production tested for 5.8 days and produced at an average rate of 736 bbl/d oil and 2,660 mcf/d gas (net of load fluid and energizing fluid) over that period which includes the initial cleanup where only load water was being recovered. At the end of the test, flowing wellhead pressure and production rates were stable.

The D5-19 Lower Montney well was production tested for 12.6 days and produced at an average rate of 170 bbl/d oil and 580 mcf/d gas (net of load fluid and energizing fluid) over that period which includes the initial cleanup where only load water was being recovered. At the end of the test, flowing wellhead pressure and production rates were stable.

The E5-19 Lower Montney well was production tested for 11.4 days and produced at an average rate of 312 bbl/d oil and 890 mcf/d gas (net of load fluid and energizing fluid) over that period which includes the initial cleanup where only load water was being recovered. At the end of the test, flowing wellhead pressure was stable, and production was starting to decline.

The F5-19 Lower Montney well was production tested for 4.9 days and produced at an average rate of 728 bbl/d oil and 1,607 mcf/d gas (net of load fluid and energizing fluid) over that period which includes the initial cleanup where only load water was being recovered. At the end of the test, flowing wellhead pressure and production rates were stable.

The G5-19 Lower Montney well was production tested for 7.1 days and produced at an average rate of 415 bbl/d oil and 1,489 mcf/d gas (net of load fluid and energizing fluid) over that period which includes the initial cleanup where only load water was being recovered. At the end of the test, flowing wellhead pressure and production rates were stable.

The H5-19 Lower Montney well was production tested for 8.1 days and produced at an average rate of 411 bbl/d oil and 1,166 mcf/d gas (net of load fluid and energizing fluid) over that period which includes the initial cleanup where only load water was being recovered. At the end of the test, flowing wellhead pressure was stable and production was starting to decline.

A pressure transient analysis or well-test interpretation has not been carried out on these nine wells and thus certain of the test results provided herein should be considered to be preliminary until such analysis or interpretation has been completed. Test results and initial production rates disclosed herein, particularly those short in duration, may not necessarily be indicative of long-term performance or of ultimate recovery.

Any references to peak rates, test rates, IP30, IP90, IP180 or initial production rates or declines are useful for confirming the presence of hydrocarbons, however, such rates and declines are not determinative of the rates at which such wells will continue production and decline thereafter and are not indicative of long-term performance or ultimate recovery. IP30 is defined as an average production rate over 30 consecutive days, IP90 is defined as an average production rate over 90 consecutive days and IP180 is defined as an average production rate over 180 consecutive days. Readers are cautioned not to place reliance on such rates in calculating aggregate production for the Company.

For further information, please contact:

Coelacanth Energy Inc.
2110, 530 – 8th Ave SW
Calgary, Alberta T2P 3S8
Phone: (403) 705-4525
www.coelacanth.ca

Robert Zakresky
President and Chief Executive Officer

Nolan Chicoine
Vice President, Finance and Chief Financial Officer

Neither the TSX Venture Exchange nor its Regulation Services Provider (as that term is defined in the policies of the TSX Venture Exchange) accepts responsibility for the adequacy or accuracy of this release.

To view the source version of this press release, please visit https://www.newsfilecorp.com/release/249585

News Provided by Newsfile via QuoteMedia

This post appeared first on investingnews.com