Author

admin

Browsing

While investors are bracing themselves for a Pi Network Price pump, one expert has predicted a start date for the rally. Cryptocurrency analyst Dr Altcoin says Pi Coin price will spike during the upcoming Consensus Summit, with Pi Network founder billed to deliver a keynote address.

Pi Network Price Eyes Massive Rally In May

According to an X post, cryptocurrency analyst Dr Altcoin is forecasting the start of a Pi Coin rally in mid-May. Dr Altcoin notes that investors can expect the start date of the Pi Network price during the Consensus Summit scheduled for May.

Dr Altcoin’s predictions differ from previous projections that tip the start of a Pi Coin rally toward late August. Investors previously hinged their hope for a price rally after the end of the Pi unlocking event, set to release 212 million Pi Coins.

However, Dr Altcoin is predicting the rally to begin much earlier in May, triggered by the momentum around the Consensus event. Dr Altcoin has previously revealed why Consensus 2025 will be pivotal for the Pi Network, given the sheer volume and calibre of attendees.

“I am fairly confident that the price pumping of Pi might start during the Consensus Summit (May 14-16, 2025) rather than at the end of August when Pi unlocking significantly reduces,” said Dr Altcoin.

Several Factors May Delay The Start Date Of The Price Rally

Dr Altcoin’s prediction for the launch of the Pi Network price rally in May faces a raft of challenges. Right out of the bat, the Pi Core Team (PCT) is racing against the clock to approve KYB applications before the start of Consensus 2025.

Furthermore, Dr Altcoin says the launch of decentralized applications (DApps) on the network before Consensus 2025 will support a price rally. While the PCT achieves the milestones before Consensus 2025, other external factors are angling to adversely affect Pi Network prices.

Dr Altcoin has raised alarm over shady activity on Banxa that may trigger artificial volatility for Pi Coin Price. Keen on playing its part to stabilize prices, the PCT has begun purchasing Pi Coins on centralized exchanges, mopping up over 48 million coins.

Currently, Pi Network trades at the $0.6 mark, holding the price level for over a week as investors scan the charts for signals of a seismic rally.

Furthermore, Dr Altcoin is hinging his resolve for a rally on seven Pi Network pros, including accessibility and sustainability perks. The cryptocurrency expert name-checks its security features, low gas fees, and regulatory compliance.

The post Expert Predicts Start Date For Pi Network Price Pump, Here’s When appeared first on CoinGape.

Arbitrum, the leading Layer-2 network’s much anticipated partnership with Nvidia has collapsed. This has sent ripples through the crypto and tech communities

It was all set for a significant milestone – joining the Ignition AI Accelerator program of Nvidia. With this partnership, the layer-2 network would become the go-to-blockchain for AI projects developing under Nvidia’s program.

The Ignition AI Accelerator program launched in May 2024 provided high-potential AI startups comprehensive support. Arbitrum wanted to rope into these startups to help them build decentralized infrastructure.

However, according to the latest Arbitrum-Nvidia update, the partnership has failed miserably.

The partnership was initially seen as a landmark collaboration between blockchain scalability and AI . And now the termination of the alliance highlights continued divergence between the traditional tech world and the rapidly evolving Web3 ecosystem.

Why did Nvidia-Arbitrum Partnership Failed

BrandTalk alaways aims to provide you factual reporting, So the fact is there was no direct partnership between Nvidia and Arbitrum.
The collaboration was to happen between Nvidia’s The Ignition Accelerator Program and Arbitrum.

In the press release on April 25, the program has issued a statement of clarification. It had revealed that it was Arbitrum Foundation that have requested to pull out from it. It clarified that it was not “Nvidia” or its supported program that snubbed the partnership.

It is important to note that The Ignition AI Accelerator is a cohort-based, four-month program which selects up to 15 high-potential AI startups. Eligible applicants must demonstrate a clear AI-focused product vision and unique technology addressing real-world needs. Applications are open to founders of new AI startups or AI leads of existing ventures.

It clearly mentions in its eligibility criteria that certain kind of projects are excluded from the application.

These are:

  • cryptocurrency/blockchain-only projects,
  • consulting or outsourced development firms,
  • cloud service providers,
  • hardware/software resellers or distributors, and
  • publicly traded companies .

Market Reaction

Arbitrum (ARB) briefly dipped 2.77% to trade at $0.3436, reflecting an initial investor pullback on the partnership fall out news.

Despite that drop, some markets saw ARB rally roughly 5% over the following 24 hours. It is hovering near $0.34 as traders bet on Arbitrum’s pivot to other partnerships and on-chain resilience.

For the broader crypto impact, Ethereum remained steady around $1,810. There is possibility of imminent crash as Ethereum whales dump 63k coins.

In response to the breakup, several smaller AI-focused crypto projects also saw a modest bump in token prices. These include Fetch.ai and Ocean Protocol as investors turn to bet on native Web3 players to fill the vacuum.

Do Web3 Firms Require Tech Giant Partnership

Arbitrum’s reported decision to step out of the partnership is not revealed yet.

However, the Arbitrum-Nvidia breakup underscores the growing pains of the Web3 industry as it seeks to collaborate with established corporate giants.

It serves as a reminder that traditional corporations’ values can be at odds with Web3’s decentralization ethos.

Moreover, the incident reignites an ongoing debate: Can decentralized AI infrastructures scale effectively without reliance on centralized tech giants?

Many in the crypto community argue that decentralized AI must be built independently. It should leverage open-source communities rather than corporate partnerships.

The post Why Arbitrum-Nvidia Partnership Collapsed – And What It Means for Web3 appeared first on CoinGape.

The crypto market this week has primarily propelled an optimistic sentiment among traders and investors globally by showcasing bullish price trajectories. Bitcoin (BTC) price has gained over 10% in the past seven days, nearing $94K. Whereas, major altcoins like Ethereum (ETH), Solana (SOL), and XRP surged 3%-11% weekly. Meanwhile, even the meme coin market saw DOGE, SHIB, and PEPE prices rallying unprecedentedly in the interim.

Mentioned below are some of the top cryptocurrency market highlights reported by CoinGape Media over the past week.

Crypto Market This Week: BTC, ETH, SOL, XRP Price Action Ignites Optimism

As per CoinMarketCap’s data, BTC price closed the week at $93,953, surging slightly over 10% over the past seven days. Primarily, the flagship coin saw a bullish action against the backdrop of a stockpile of optimistic developments this week.

CoinGape Media reported that Japan’s Metaplanet acquired another 330 BTC in one of its latest haul over the week.

On the other hand, Robert Kiyosaki has predicted that Bitcoin price is poised to hit $180,000 to $200,000 in 2025. Particularly, this bullish prediction gained significant traction across the broader crypto market as the flagship coin showcased other bullish signs, hinting that such a feat is possible.

BTC futures OI topped the $64 billion mark as the week came to an end, per Coinglass data. On the other hand, even the U.S. spot Bitcoin ETF products recorded $3 billion worth of inflows this week. Overall, the abovementioned market stats underscore substantially heightened market interest in Bitcoin over the past week.

Altcoin Mirror Bullishness

Simultaneously, major league altcoins have also witnessed a notable bullish movement in the past seven days.

ETH price rose over 11% weekly, closing this week near $1,800. This bullish action comes attributed to massive ETH whale accumulations, with reportedly $100 million worth of coins stacked by large-scale investors this week.

Besides, SOL price surged nearly 4% in the same duration, exchanging hands at $146. Even XRP price has followed the broader market trend, pumping over 4% weekly, reaching $2.16.

For context, Bitcoin and the broader crypto market appear to be witnessing a positive investor sentiment amid Donald Trump’s hint at further delay on certain tariffs. Other tokens like DOGE, SHIB, and PEPE also extended price gains to 12%-21% this week.

The post Crypto Market This Week: BTC & Major Altcoins Show Bullish Signs, What’s Happening? appeared first on CoinGape.

After an aggressive Bitcoin (BTC) accumulation spree since the start of the year, MicroStrategy and Metaplanet have racked up impressive gains. Recent disclosures indicate that MicroStrategy’s BTC holdings have resulted in US dollar gains of 5.1 billion, while Metaplanet is sitting on a $191 million gain in 2025 alone.

MicroStrategy And Metaplanet Record Impressive BTC $ Gains In 2025

MicroStrategy and Metaplanet are sitting on unrealized gains from their Bitcoin holdings since the start of the year. According to MicroStrategy CEO Michael Saylor in an X post, the software company has racked up over $5.1 billion in BTC $ Gain from its treasury operations in 2025 alone.

On the other hand, Tokyo-based Metaplanet has earned its fair share of BTC $ Gain in the same window. Metaplanet executive Dylan LeClair disclosed on X that the firm’s treasury operations have netted an impressive BTC $ Gain of  $191 million year-to-date.

“Year to date, Metaplanet treasury operations have generated a BTC $ Gain of 191 million,” said Dylan LeClair.

For Metaplanet, a large chunk of the BTC $ Gain came from its Q1 Bitcoin purchases, dwarfing all other previous quarters.

Both firms have adopted an aggressive stance toward Bitcoin purchases in recent months. MicroStrategy’s latest purchase of 6556 BTC brings its holdings to $538,000, while Metaplanet added 145 Bitcoin to reach the 5,000 BTC milestone.

To fund their bitcoin accumulation spree, both firms have turned to stock and bond issuances in recent months. Despite the spike in BTC $ gains, MicroStrategy and Metaplanet will face steep tax liabilities if they decide to cash in their new gains.

A Strong BTC Rally Sends Prices Above $95,000

The spike in Bitcoin dollar gains for MicroStrategy and Metaplanet follows a remarkable price performance for Bitcoin in 2025. Astute treasure operations of stacking BTC across several price corrections saw both firms scoop Bitcoins at a discount in Q1.

Bitcoin price nearing $100K has triggered paper gains for the MicroStrategy and Metaplanet with executives firming their resolve to continue BTC accumulation.

At the moment, Bitcoin is trading at $95,000 after an impressive run over the last week, garnering an 11% increase. Over 24 hours, BTC has gained a modest 1%, but a 48% decline in transaction volume may signal a price correction in the near future.

Several reasons are in play for the Bitcoin price rally, including China increasing its gold holdings by five tonnes. Other factors include multiple tests on lower support levels and wading in of heavy institutional investors to BTC amid macroeconomic uncertainties.

The post MicroStrategy And Metaplanet See $5.1 Billion Gain From Bitcoin Treasury Operations appeared first on CoinGape.

Fresh reports from the International Monetary Fund (IMF) indicate that El Salvador is complying with loan conditions. One key aspect of the loan conditions revolves around the halting of Bitcoin purchases with public funds, but President Nayib Bukele is keen on sidestepping hurdles.

El Salvador Halts Bitcoin Accumulation To Comply With The IMF

According to details of a press briefing by the IMF’s Western Hemisphere Department, El Salvador has paused its Bitcoin purchases with public sector funds. Rodrigo Valdes, the IMF’s Director of the Western Hemisphere Department, confirmed the changing government stance to achieve compliance with loan conditions.

As part of a $1.4 billion loan deal, the IMF required El Salvador to halt public sector accumulation of Bitcoin. Despite initial pushback from President Nayib Bukele, Valdes confirms that the government is holding its end of the bargain.

Valdes disclosed that El Salvador is in full compliance with its loan obligations, squashing speculation that the country violates its terms.

“In terms of El Salvador, let me say that I can confirm that they continue to comply with their commitment of non-accumulation of bitcoin by the overall fiscal sector, which is the performance criteria that we have,” said Valdes.

Apart from shuttering its public sector BTC accumulation, the IMF notes that the country is also ticking the boxes in fiscal transparency and structural reforms. With the current Bitcoin price close to $100K, the value of El Salvador’s 6,158 BTC stands at $583 million.

Nayib Bukele Continues Daily BTC Accumulation

Despite the requirement against public sector Bitcoin purchases, the Latin American country continues to stack up its BTC holdings. According to data from the National Bitcoin Office, El Salvador is buying one Bitcoin per day in defiance of the IMF.

Rather than limit its BTC accumulation to public sector funds, El Salvador’s President Nayib Bukele is exploring alternative sources. Bukele has previously disclosed that the country’s Bitcoin accumulation will continue amid IMF pressure to limit its options.

The National Bitcoin Office has not publicly disclosed its funding sources for the daily BTC purchases, stoking a wave of speculation. The consensus is that the government is tapping non-public sector entities to power its daily Bitcoin accumulation spree.

The country may be funding its daily purchases from the profits of its Strategic Bitcoin Reserve, with the average purchase price sitting at around $44,000. Other countries, keen on mirroring El Salvador’s lead, are eyeing a Strategic Bitcoin Reserve, with Samson Mow making a strong case for Japan.

Apart from financial inclusion and reducing its dollar dependency, President Bukele is eyeing a raft of economic benefits. Cathie Wood’s Ark Invest predicts the Bitcoin price to climb as high as $1.5 million per BTC by 2030, potentially sending the value of El Salvador’s holdings to astronomical levels.


The post El Salvador Pauses Public Sector Bitcoin Purchases To Align With IMF Loan Conditions appeared first on CoinGape.

After weeks of uncertainty, the stock market finally gave us something to smile about. The major indexes just wrapped up four straight days of gains, and optimism is starting to creep back in. Could this be the shift we’ve been waiting for?

Let’s break it down.

The big concerns this week were all about tariffs and the potential removal of Fed Chairman Jerome Powell. But markets breathed a sigh of relief when it looked like tensions might ease between the two largest global economies. Plus, Powell staying put at the Fed helped calm some nerves.

In short, the fear factor took a breather, and the bulls took charge.

What Are the Charts Telling Us?

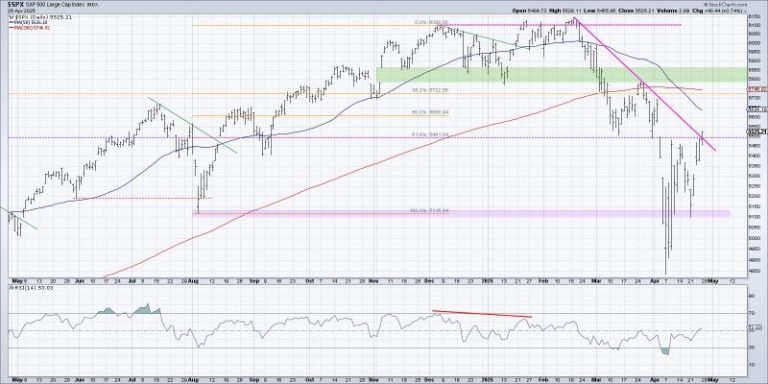
The S&P 500 ($SPX) crossed above the key 5500 level. This isn’t just any number; it’s a major line in the sand. It represents the March low and, if you go further back on the daily chart below, it has been a support and resistance level for previous price action. The purple horizontal line marks the 5,500 level.

FIGURE 1. SIGNS OF A TURNAROUND? The S&P 500 closed above the key 5,500 level, a major breakthrough. Breadth indicators are suggesting expanding bullish participation. Chart source: StockCharts.com. For educational purposes.

Even better, market breadth is improving.

We are also seeing strength across the board:

  • BPI readings for the Nasdaq 100, S&P 100, S&P 500, and Dow Industrials are all above 50%.
  • 10 of the 11 S&P 500 sectors have BPIs above 50%, with Consumer Staples being the only one with a BPI below 50. This is surprising since it was one of the only sectors above 50% not long ago.

Sector Watch: Who’s Leading?

If you’re looking for clues about the market’s next big move, watch sector rotation. Right now, leadership is coming from:

  • Technology
  • Consumer Discretionary
  • Communication Services

These are your classic “risk-on” sectors—if they’re leading, that’s typically a bullish sign.

What About Bonds, Gold, and the Dollar?

Some of the big-picture trends are starting to stabilize, too:

  • Bond yields are dipping, which is helping bond prices recover.
  • Gold pulled back after hitting new highs.
  • The U.S. dollar is showing signs of strength again.
  • And the $VIX—Wall Street’s fear gauge—is finally back below 30.

All small signs, but they add up.

Indicator of the Week: The Zweig Breadth Thrust

One indicator all technical analysts should take note of is the Zweig Breadth Thrust indicator.  It’s a rare signal that flashes when market breadth shifts quickly from bearish to bullish.

The indicator is the 10-day exponential moving average (EMA) of net NYSE advances. The NYSE Breadth Thrust signal fires when the indicator moves from below 0.40 to above 0.615 in 10 days.

The weekly chart below shows that this is the third time the Zweig Breadth Thrust signal was fired in the last five years. The last two times this occurred were in 2023, when the NYSE recovered after dipping below its 40- and 150-week simple moving average (SMA). This time, the index bounced off its 150-week SMA.

FIGURE 2. ZWEIG BREADTH THRUST FIRES A REVERSAL SIGNAL. Previous signals have been followed by bullish moves in the NYSE. Will we see a similar scenario this time? Chart source: StockCharts.com. For educational purposes.The Zweig Breadth Thrust is a bullish reversal signal. Note that each time the signal was fired, the market moved higher. It doesn’t guarantee a bull run, but it’s a green flag.

What’s Coming Next Week?

If this weren’t a headline-driven market, I would be more confident about the possibility of the market moving higher. Next week is packed with potential market-moving headlines.

  • Big Tech earnings
  • Q1 GDP
  • PCE Inflation data (the Fed’s favorite inflation gauge)
  • ISM Manufacturing
  • Non-Farm Payrolls

At the Close

The underlying market conditions are improving and some key signals are flashing green. But, as noted, it’s still a headline-driven market, and that means all the more reason to stay alert. Focus on leading sectors, watch for confirmation in breadth, and keep your investment plan tight.


End-of-Week Wrap-Up

  • S&P 500 up 4.59% on the week, at 5525.21, Dow Jones Industrial Average up 2.48% on the week at 40,113.50; Nasdaq Composite up 6.73% on the week at 17,382.94.
  • $VIX down 16.22% on the week, closing at 24.84.
  • Best performing sector for the week: Technology
  • Worst performing sector for the week: Consumer Staples
  • Top 5 Large Cap SCTR stocks: Palantir Technologies, Inc. (PLTR); Rocket Lab USA, Inc. (RKLB); Robinhood Markets, Inc. (HOOD); Rubrik, Inc. (RBRK); MicroStrategy, Inc. (MSTR)

On the Radar Next Week

  • Earnings season continues with Meta (META), Microsoft (MSFT), Apple (AAPL), Amazon (AMZN), and others reporting
  • March JOLTs Job Openings
  • Q1 GDP Growth Rate
  • March PCE
  • April ISM Manufacturing
  • April Non-Farm Payrolls


Disclaimer: This blog is for educational purposes only and should not be construed as financial advice. The ideas and strategies should never be used without first assessing your personal and financial situation, or without consulting a financial professional.

The S&P 500 index managed to log one of its strongest weeks in 2025. Short-term breadth conditions have improved, and the crucial 5500 level has now been broken to the upside. Are we in the later stages of a countertrend rally, or just in the early innings of a broader recovery for stocks?

Let’s review three key charts together and evaluate the evidence.

Trendline Break Suggests Further Short-Term Strength

My daily chart of the S&P 500 has featured a thick pink trendline since March, when a lower peak around 5800 provided a perfect opportunity to define the downtrend phase. With the quick reversal off the early April low around 4850, the SPX has finally broken back above this trendline.

To be clear, after a breakout of this magnitude, I’m always looking for confirmation from the following day. Will additional buyers come in to push this chart even further to the upside? Assuming that’s the case, then I’m immediately drawn to a confluence of resistance in the 5750-5850 range. The 200-day moving average is currently sitting right around the late March peak, and both of those levels line up well with a price gap back in November 2024.

If the S&P 500 can finally break above that resistance range, I would expect much further upside for risk assets.

Breadth Conditions Confirm Short-Term Market Strength

One of the biggest improvements I’ve seen coming out of the early April low is the upgrade in short-term breadth conditions. The McClellan Oscillator has broken back above the zero level, most days this week saw more advancers than decliners, and the Bullish Percent Index has definitely improved.

In the bottom panel, we can see that the S&P 500 Bullish Percent Index has risen from a low just above 10% at the April low to finish this week at 64%. That confirms that over half of the S&P 500 members generated a point & figure buy signal in the month of April!

But the middle panel shows the real challenge here, in that long-term measures of breadth are still clearly in the bearish range. Just 35% of the S&P 500 stocks are above their 200-day moving average, similar to the S&P 500 and Nasdaq 100. It’s only if this indicator can push above the 50% level that the S&P 500 could stand a real chance of sustainable gains above 5750.

The Stoplight Technique Lays Out a Clear Playbook

I love to overlay a “stoplight” visualization on a chart like this, helping me clarify how I’ll think about risk depending on where the S&P 500 sits at any given point.

I would argue that a confirmed break above resistance at 5500 brings the S&P 500 chart into the “neutral” bucket. In this way, we’re respecting the fact that a rally from 4850 to 5500 is a fairly impressive feat, but also acknowledging that the SPX remains below its most important long-term trend barometer, the 200-day moving average.

If we see further gains in the weeks to come, the SPX may indeed push into the bullish range, which for me would mean a push above 5750-5800. In that scenario, the S&P 500 would be clear of its 200-day moving average, and I would feel much more comfortable adding risk to the portfolio. Until and unless we see that upside follow-through, though, I’ll remain comfortably defensive.

RR#6,

Dave

P.S. Ready to upgrade your investment process? Check out my free behavioral investing course!


David Keller, CMT

President and Chief Strategist

Sierra Alpha Research LLC


Disclaimer: This blog is for educational purposes only and should not be construed as financial advice. The ideas and strategies should never be used without first assessing your own personal and financial situation, or without consulting a financial professional.

The author does not have a position in mentioned securities at the time of publication. Any opinions expressed herein are solely those of the author and do not in any way represent the views or opinions of any other person or entity.

In this video, Grayson highlights the crucial 5,500 level on the S&P 500 using our “Tactical Timing” chart. He then demonstrates two of the easiest methods for identifying the strongest stocks within key indexes like the S&P 500, NASDAQ 100 and Dow Industrials. He’ll show you how to find leading stocks that are moving higher using the New Highs feature of the Market Summary dashboard. From there, Grayson explores the Index Members page, and explains how to sort by SCTR rankings to quickly pinpoint the strongest stocks within any major index.

This video originally premiered on April 25, 2024. Click on the above image to watch on our dedicated Grayson Roze page on StockCharts TV.

You can view previously recorded videos from Grayson at this link.

Here’s a quick recap of the crypto landscape for Wednesday (April 23) as of 9:00 p.m. UTC.

Get the latest insights on Bitcoin, Ethereum and altcoins, along with a round-up of key cryptocurrency market news.

Bitcoin and Ethereum price update

Bitcoin (BTC) was priced at US$93,529.14 as markets closed for the day, up 2.2 percent in 24 hours. The day’s range has seen a low of US$92,078.75 and a high of US$94,122.31.

Bitcoin performance, April 23, 2025.

Chart via TradingView.

Fueledby the re-entry of institutional investment, the crypto markets appear to be headed towards a robust recovery; however, the long-term trajectory remains to be seen.

Ethereum (ETH) ended the day at US$1,785.14, a 5.2 percent increase over the past 24 hours. The cryptocurrency reached an intraday low of US$1,767.67 and a high of US$1,815.24.

Altcoin price update

  • Solana (SOL) ended the day valued at US$150.05, up four percent over 24 hours. SOL experienced a low of US$149.31 and peaked at $153.47.
  • XRP traded at US$2.22, reflecting a three percent increase over 24 hours. The cryptocurrency recorded an intraday low of US$2.20 and reached its highest point at US$2.29.
  • Sui (SUI) was priced at US$2.98, showing an increaseof 21 percent over the past 24 hours. It achieved a daily low of US$2.89 and a high of US$3.06.
  • Cardano (ADA) was trading at US$0.6981, up 6.3 percent over the past 24 hours. Its lowest price on Wednesday was US$0.6873, with a high of US$0.7138.

Today’s crypto news to know

Riot Platforms secures US$100 million credit facility backed by Bitcoin

Riot Platforms (NASDAQ:RIOT) secured a US$100 million credit facility from Coinbase (NASDAQ:COIN) on Wednesday (April 23), using a massive Bitcoin stockpile as collateral.

Data from Bitcoin Treasuries indicates that Riot holds 19,223 BTC valued at approximately US$1.8 billion, making the company the third-largest corporate Bitcoin treasury behind Michael Saylor’s Strategy and MARA Holdings.

“Riot has entered into its first bitcoin-backed facility, which provides us with non-dilutive funding at an attractive cost of financing,” said Jason Les, CEO of Riot, in a press release. “This credit facility is a key part of our efforts to diversify sources of financing to support our operations and strategic growth initiatives, with a view towards long-term stockholder value creation.”

Brandon Lutnick forms new Bitcoin investment vehicle

Brandon Lutnick, son of US Commerce Secretary and former Cantor Fitzgerald Chairman Howard Lutnick, will launch a listed Bitcoin investment vehicle through a reverse merger with Cantor Equity Partners, a special purpose acquisition company (SPAC). This is according to a Tuesday (April 22) report by the Financial Times (FT).

The newly-established entity, purportedly named Twenty One Capital, will be led by co-founder Jack Mallers, the CEO of Bitcoin-focused payments app Strike, and majority owned by Tether (USDT) and cryptocurrency exchange Bitfinex. SoftBank (TSE:9984, OTCPINK:SOBKY) will also own a ‘significant minority’ stake. Sources for FT say Tether will contribute at least US$1.5 billion worth of Bitcoin.

The company will also raise US$385 million through a convertible bond and US$200 million via a private equity placement, which will be used to acquire more Bitcoin. Eventually, SoftBank, Tether and Bitfinex’s investments will be converted from Bitcoin into shares in Twenty One Capital, with a price of US$13 per share for the private placement and US$10 per share for the convertible bond.

According to the report, Twenty One Capital will launch with 42,000 BTC, making it the world’s third-largest Bitcoin reserve. “With a visionary leader at the helm and backing from two renowned industry leaders, Twenty One is designed to help investors capture value from Bitcoin’s growing global demand and increasing institutional adoption,” Lutnick said in a press release on Wednesday. The deal values the new company at US$3.6 billion based on an approximate US$85,000 Bitcoin valuation. As of writing, Bitcoin is valued at US$93,808.31.

Trump to Host Exclusive Dinner for $TRUMP Token Holders

Lauded as “the most exclusive invitation in the world”, US President Donald Trump will host a dinner for the top 220 holders of his $TRUMP token in Washington, D.C. on May 22. News of the event, which was announced on the memecoin’s official website, sent $TRUMP’s valuation up by over 55 percent in under an hour. $TRUMP reached US$14.44 at around midday on April 23, its highest valuation since mid-February. As of writing, $TRUMP is valued at US$13.46.

Top token holders are required to link their wallets for holding verification. The top 25 holders will gather for a private reception with the President before dinner.

Around 40 million $TRUMP tokens, or roughly 20 percent of the tokens’ circulating supply, were unlocked on April 17, valued slightly above US$300 million at the time. $TRUMP reached an all-time high of US$75.35 on January 19, according to data from CoinMarket Cap. This was followed by an abrupt reversal and steady decline in Q1 to valuations between US$9 – US$7 in April.

Bitcoin ETFs see US$936 million in daily inflows

US-listed spot Bitcoin exchange-traded funds (ETFs) recorded their strongest day of inflows since January, pulling in a combined US$936 million on Tuesday (April 22) across 10 issuers.

Leading the charge were Ark & 21Shares with US$267.1 million, Fidelity’s FBTC with US$253.8 million and BlackRock’s IBIT, which added US$193.5 million.

Over the past three days, total net inflows into Bitcoin ETFs have surpassed $1.4 billion, signaling renewed institutional confidence in crypto markets. Analysts attribute the momentum to persistent inflation, a weakening US dollar and growing fears over geopolitical instability, prompting investors to turn to Bitcoin as a hedge.

While still volatile, Bitcoin is increasingly being framed as “digital gold,” with ETF flows suggesting it’s becoming a staple in diversified portfolios. This week’s influx also reflects optimism that regulatory conditions are maturing, particularly in the US, where ETFs are rapidly gaining legitimacy among mainstream investors.

Bitcoin becomes fifth largest global asset, overtakes Google

Bitcoin has climbed to a market capitalization of US$1.86 trillion, overtaking Alphabet (NASDAQ:GOOGL) to become the world’s fifth-largest asset by market value. The price of Bitcoin surged past US$94,000, helped by easing trade tensions between the US and China and renewed bullish sentiment across tech and risk-on assets.

This marks a symbolic milestone for the cryptocurrency, which has now outpaced several of the world’s most valuable tech giants. Analysts point to Bitcoin’s increasing correlation with macroeconomic tailwinds — such as falling bond yields and speculative interest in risk assets — as drivers of the recent price action.

Its breakout relative to the Nasdaq also suggests growing investor confidence in crypto as a parallel to tech. If Bitcoin maintains this trajectory, some believe it could soon challenge silver’s position as the fourth-largest global asset.

Trump backs crypto regulation, Trump Media eyes retail crypto products

During a public appearance, US President Donald Trump called for regulatory certainty in the crypto industry and vowed to provide ‘clear rules of the road’ for digital asset innovation.

His statement coincided with Trump Media & Technology Group’s announcement that it will partner with Crypto.com and Yorkville America Digital to launch retail investment products, including crypto-focused ETFs aligned with Trump’s “America First” platform. The planned offerings aim to capitalize on the president’s growing presence in the digital asset space following prior ventures like Trump NFTs and crypto-affiliated partnerships.

While no official ETF filings have been submitted yet, the initiative signals Trump’s commitment to making crypto a policy priority as part of his economic strategy.

Tesla reports US$951 million in Bitcoin holdings despite earnings miss

Tesla (NASDAQ:TSLA) revealed it continues to hold $951 million worth of Bitcoin on its balance sheet, despite posting weaker-than-expected quarterly revenue of US$19.34 billion.

The automaker’s Bitcoin holdings, totaling 11,509 BTC, remained unchanged during the quarter, with no buy or sell activity recorded. This comes as Bitcoin’s price dipped from late December highs, impacting Tesla’s valuation of its digital asset portfolio under the new Financial Accounting Standards Board rules.

These rules now require corporations to mark digital assets to market on a quarterly basis, increasing transparency but also exposing earnings to crypto market volatility. Tesla’s crypto exposure, while relatively small compared to its core business, still makes it one of the top public holders of Bitcoin globally.


Securities Disclosure: I, Giann Liguid, hold no direct investment interest in any company mentioned in this article.

Securities Disclosure: I, Meagen Seatter, hold no direct investment interest in any company mentioned in this article.

Keep reading…Show less
This post appeared first on investingnews.com

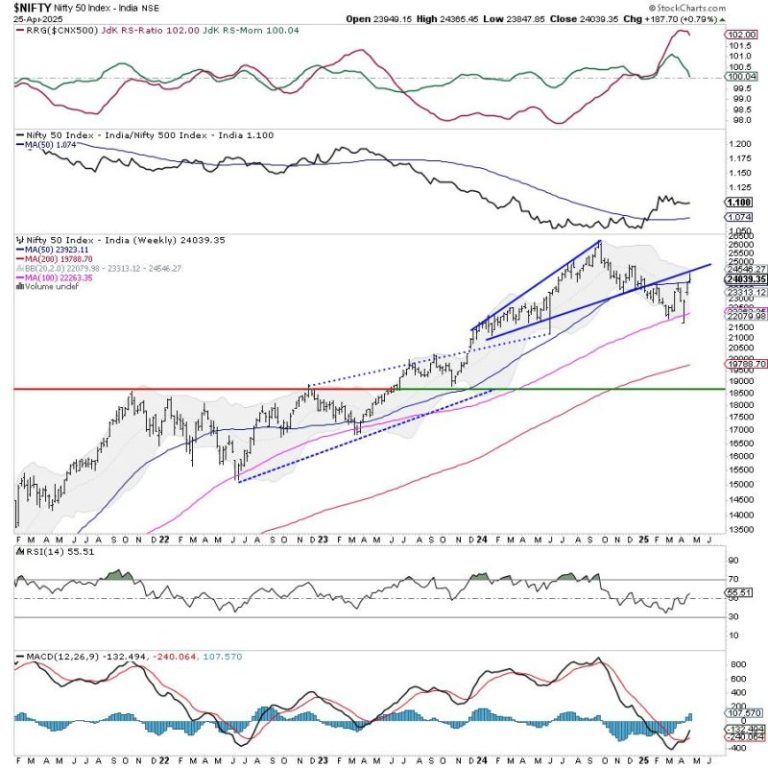
Following a strong move the week before, the markets took on a more consolidatory look over the past five sessions. Following ranged moves, the Nifty closed the week on just a modestly positive note. From a technical standpoint, the Nifty tested a few important levels on both daily and weekly charts. However, the trading range narrowed. The Index oscillated in a 517.60-point range over the past week. The volatility surged again; the India VIX spiked 10.93% to 17.16. The headline index went on to close with a modest weekly gain of 187.70 points (+0.79%).

The coming week is shortened, with Thursday being a trading holiday due to Maharashtra Day. We could write about more than one thing that the markets could be worried about over the coming days. It could be the lowered growth forecasts by the IMF that include India and other economies; it could also be the heightened possibility of escalating geopolitical tensions between India and Pakistan. However, all that said, the markets are also at a crucial technical juncture. The Nifty has closed just at the 200-DMA placed at 24050. Besides this, Index has also defended the 50-week MA at 23925. This makes the 23,900-24,050 zone a crucial support area for the Nifty. The consolidation is imminent as the Nifty has rebounded over 11% from its April 07 lows, and minor corrective retracements cannot be ruled out. However, if 23900 is breached, the markets may see some extended retracements.

The weekly RSI is at 55.46; it stays neutral and does not show any divergence against the price. The weekly MACD is bullish and stays above its signal line. A candle resembling a Shooting Star has emerged, increasing the likelihood of consolidation. Importantly, any candle formation should not be traded in isolation and must be used in conjunction with the overall technical setup.

The pattern analysis shows that the Nifty has defended the 50-week MA placed at 23925. The Index has also tested a rising trendline resistance; it violated this trendline support on its way down, and now this is expected to act as resistance. Overall, the zone of 24050-23900 is a crucial support zone for Nifty. If the level of 23900 is violated, it can lead to incremental weakness.

Overall, the technical structure of the market suggests that it is time for one to focus more on protecting gains at higher levels. While there could be some reactions by the markets due to external factors, the underlying buoyancy stays intact. The only thing to be cautious about is the natural corrective retracements that the market may experience following the steep upward move that has taken place. Investors must keep fresh purchases should be kept in low-beta stocks that have strong relative strength. With sector rotation visible, a cautious outlook is advised for the day.


Sector Analysis for the coming week

In our look at Relative Rotation Graphs®, we compared various sectors against CNX500 (NIFTY 500 Index), which represents over 95% of the free float market cap of all the stocks listed.

Relative Rotation Graphs (RRG) show the Nifty PSU Bank Index has rolled inside the leading quadrant. The Consumption, Commodities, Financial Services, Infrastructure, Metal, and Nifty Bank Indices are also inside the leading quadrant. While the weakening of Relative Momentum is seen in the Metal and Financial Services Index, they are likely to outperform the broader markets relatively.

The Nifty Services Sector Index has rolled inside the weakening quadrant.

The Midcap 100 and the Realty Index are showing strong improvement in their Relative Momentum while staying inside the lagging quadrant. The IT and the Auto Index continue to languish inside the lagging quadrant.

The Media Index has rolled inside the Improving quadrant, indicating a likely beginning of its phase of relative outperformance. The Nifty PSE, Energy, and FMCG Indices are also inside the improving quadrant.


Important Note: RRG charts show the relative strength and momentum of a group of stocks. In the above Chart, they show relative performance against NIFTY500 Index (Broader Markets) and should not be used directly as buy or sell signals.  


Milan Vaishnav, CMT, MSTA

Consulting Technical Analyst

www.EquityResearch.asia | www.ChartWizard.ae