Author

admin

Browsing

The market does not always follow the same script or sequence, but bear markets typically end with a bottoming process marked by specific stages. These include capitulation, a short-term reversal-thrust, a follow-through thrust and long-term regime change. The first two stages mark downside excess and the initial turn around, while the latter two signal strong follow through. Today’s report will look at the first two phases, and preview the last two.

Phase 1: Capitulation

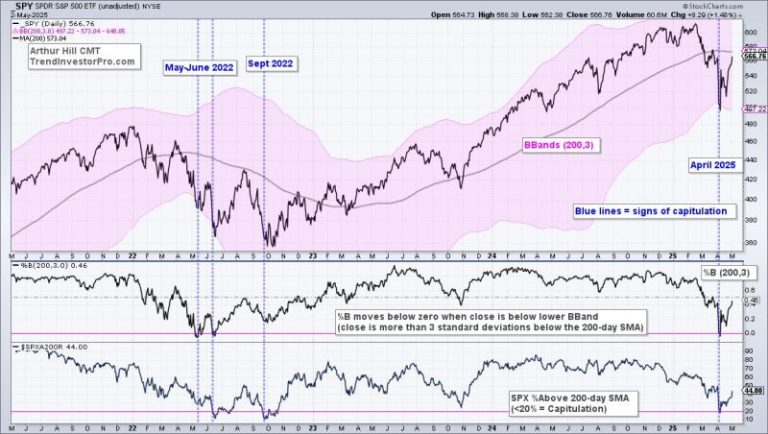
The capitulation phase of a bear market occurs when traders throw in the towel as downside momentum and selling pressure accelerate. Usually, the capitulation phase occurs after an extended decline, and this phase is the first step to a bottom. The chart below shows SPY with Bollinger Bands (200,3), %B (200,3) and S&P 500 Percent Above 200-day SMA ($SPXA200R). Signs of capitulation emerge when %B is below 0 and/or fewer than 20% of S&P 500 stocks are above their 200-day SMAs. The blue dashed lines show capitulation in June 2022, September 2022 and early April 2025. Note that we initially covered this capitulation phase in a report on April 8th.

Phase 2: Short-term Thrust Signals (ZBT)

Phase 2 is marked by a sharp-reversal from oversold extremes and an upside thrust. The Zweig Breadth Thrust is perhaps the most famous thrust indicator these days. We covered the ZBT extensively over the last few weeks and introduced a strategy using this indicator. The chart below shows the S&P 1500 ZBT indicator in the lower window (10-day EMA of S&P 1500 AD%). A thrust signal triggered on April 24th and stocks followed through with further gains.  

Two Down and Two to Go

The capitulation phase showed excessive selling pressure and the thrust phase marked a short-term reversal. These are bullish events, but the market cup is not yet half full. SPY remains below its 200-day SMA and the late March high (see chart above). Medium-term thrust indicators have yet to trigger and long-term breadth remains bearish. The 14% surge over the last 17 days is impressive, but keep in mind that SPY surged 10% in nine days in March 2022, which was a bear market bounce.

TrendInvestorPro produced a report this week covering the four phases – and what to watch going forward. Click here to take a trial and get immediate access.

  • Phase 1: Capitulation
  • Phase 2: Short-term Thrust Signals
  • Phase 3: Medium-term Thrust Signals
  • Capitulation and Thrust Indexes
  • Phase 4: Long-term Indicators turn Bullish
  • Short-term Improvements, but Longer Term 

//////////////////////////////////////////////////////

Plans for the smooth sailing of fresh stablecoin regulation have hit a curb following a group of Congressmen’s decision to withdraw their support. US senators are rejecting the GENIUS Act in its current form in a move that can derail the outcome of a final vote.

 10 US Senators Will Not Vote In Favor Of The GENIUS Act

According to an X post by cryptocurrency journalist Eleanor Terrett, a group of US senators are poking holes in The Guiding And Establishing National Innovation For US Stablecoins (GENIUS Act) over its provisions. The senators, led by Ruben Gallego, have issued a joint statement criticizing the updated text of the stablecoin regulation.

Per the Congressmen, the GENIUS Act requires tighter provisions on anti-money laundering and national security guardrails. Furthermore, the group is pushing for additional provisions to protect the local financial ecosystem from undue disruptions.

The senators are raising concerns over the lack of clarity of foreign stablecoin issuers and the potential threat to national security. Finally, the joint statement takes swipes at the absence of stiff penalties for issuers that fail to meet the standards of the GENIUS Act.

A previous Coingape report notes that US senators will vote for the GENIUS Act before May 26. However, the senators will not vote for the bill in its current form unless the provisions are modified.

“While we are eager to continue working with our colleagues to address these issues, we would be unable to vote for cloture should the current version of the bill come to the floor.

Stablecoin Issuers May Face Disruption To Their Compliance Plans

While it seemed that the GENIUS Act was hurtling toward full approval, the joint statement by the group of senators complicated matters. For starters, there is a possibility that the dissent may grow, potentially affecting the voting outcomes and triggering a delay.

Bo Hines has previously predicted the rollout of stablecoin regulation before June, but fresh dissent could prolong the passage. If the bill fails to pass the House vote, there is the potential for reconsideration after fresh amendments.

Stablecoin issuers will be the hardest hit, with the delay affecting their short-term and mid-term plans. Ahead of incoming stablecoin regulation, Tether has unveiled plans to release a stablecoin for US users, going head-to-head with the USD1 stablecoin.

Amid the absence of regulatory clarity, Ripple has paused minting RLUSD stablecoins after crossing the $300 million market capitalization mark. A delay to the timeline of the GENIUS Act will affect the listing of WLFI’s USD1 stablecoin on centralized exchanges.


The post US Senators Withdraw Support For GENIUS Act: Here’s Why appeared first on CoinGape.

Ripple Labs-affiliated coin is in the spotlight as the XRP trading volume and price show bearish consolidation on the daily chart. At the time of writing, the XRP price had slipped by 0.16% in 24 hours and is now changing hands for $2.191. The digital currency moved from a low of $2.18 to a high of $2.2 before settling at the current level. The XRP volume may determine its next major shift amid the close trading range shift.

XRP Trading Volume Drops, Should Investors Be Worried?

XRP trading volume is one of the core metrics that gauges investor interest and adoption trends. According to data from CoinMarketCap, the volume has dropped by 32.5% to $1,445,253,443.43. This drop is unusual, as the coin has recorded mostly high volume for most of the week.

Beyond XRP, other tokens within the Ripple ecosystem, including RLUSD, have also seen a drop in volume. Market data shows that the stablecoin has dropped 57.87%, with just $23,583,892.16 traded in 24 hours.

There has been a correlation between the XRP price and RLUSD volume, as reported on different occasions. For instance, when the stablecoin volume rallied by 45% in 24 hours on April 24, speculation mounted that the XRP price could reclaim a 45% high. Although this forecast has yet to materialize, the odds have always remained high.

With trading volume now down, whether or not the bullish momentum can be sustained remains unknown.

What Next For Ripple Coin?

A number of events in the Ripple Labs ecosystem are set to change the outlook of the coin remarkably. The acquisition of Hidden Road for $1.25 billion and the hype around the firm’s bid on Circle remained on the horizon.

While these trends can shape the broader ecosystem sentiment around the XRP price, the historical outlook might help determine what to expect for the rest of May.

According to Cryptorank data, the coin’s average growth rate is over 25%, setting it up for a potentially bullish run. Thus far this month, despite the broader market volatility, the coin has recorded a marginal growth of 0.21%.

If history repeats itself and XRP trading volume reverts to positive, the Ripple coin may see a breakout. Despite the XRP ETF decision delay from the US SEC, the eventual approval of the product can help shape long-term settlement around the coin. With Paul Atkins now the Chairman and the commission’s pro-crypto stance, the expectation of the ETF approval remains high. 

The post Ripple (XRP) Update: XRP Trading Volume Drops 32%, Falls to $1.44 Billion appeared first on CoinGape.

Shibarium transactions have surged in the last 24 hours, providing a bullish outlook for the SHIB price. This development comes as crypto analyst Javon Marks predicted a 100% surge for the meme coin, which is still looking to break above the psychological $0.000020 price level.

What’s Next For SHIB Price As Shibarium Transactions Surge

Crypto analyst Javon Marks has predicted that the SHIB price could rally to the $0.00003 range. He stated that Shiba Inu is starting to respond to a large bullish divergence and a full recovery, and a bullish continuation can send the top meme coin back to this range, which would represent a surge of over 100%.

This comes as the Shibarium transactions surged in the last 24 hours, which is bullish for the meme coin. Shibariumscan data shows that the transactions surged from 2.43 million on May 1 to 3.1 million on May 2, representing a surge of just over 27%.

Shiba Inu’s burn rate also provides a bullish outlook for the SHIB price. Shibburn data also shows that the burn rate has surged by over 25,353% in the last 24 hours, with 26.3 million SHIB tokens burned during the period. Token burns are bullish, which could spark a price surge for the meme coin as demand skyrockets.

Onchain Metrics Are Still Bearish For The Meme Coin

IntoTheBlock data shows that other on-chain metrics are still bearish for the SHIB price. The Net Network Growth metric is still bearish, indicating that new users aren’t adopting the meme coin.

The ‘In The Money’ metric is also bearish. With 57% of holders currently out of the money, Shiba Inu is at risk of a sell-off, which could lead to a significant decline for the foremost meme coin.

Meanwhile, the ‘Concentration’ and ‘Large Transactions’ metrics are also bearish for Shiba Inu. This indicates that crypto whales aren’t accumulating SHIB at the moment. Whales play a major role in price rallies, and their lack of accumulation could derail any potential rally.

However, a positive for the SHIB price is the recent highlight of the SHIB pay as a permissionless, on-chain alternative to the traditional financial (TradFi) system.

The post Shibarium Transactions Surge 27%, What’s Next for SHIB Price? appeared first on CoinGape.

Ethereum price is poised to reclaim its previous highs in a rally that could see ETH surpass $2,000 in the short term. The optimism is fuelled by a raft of factors, including ETH’s historically strong performance in May and an avalanche of institutions flooding the network.

Ethereum Price Set To Stage Recovery In May

While the chatter about Ethereum’s decline has reached a fervent pitch, optimism is growing for a near-term rally for ETH. Pseudonymous cryptocurrency analyst Cyclop, in an X post, opined that the network’s historically strong showing in May is a key piece of the puzzle.

Ethereum price has gained an average of 27.36% at the end of May since 2o16, famously spiking by 70.29% in 2017. Last year, ETH wrapped up the month of May with a 24.65% increase, stoking optimism for another strong performance in 2025.

Cyclop is predicting an ETH rally to 2,500 by the end of May, riding on seasonal strength. According to a chart shared by the pseudonymous TraderPA, ETH has closed its most bullish monthly candle in 2025.

“The last time we closed with a hammer candle, the price surged by 60% afterward,” said TraderPA.

However, investors have to keep their eyes on prevailing fundamentals like UK regulators moving to ban the DeFi loan market.

Institutional Investors Are Backing Ethereum Despite Price Performance

A raft of institutional behemoths is turning to the network in their pivot to blockchain solutions. China’s Alibaba is rolling out an Ethereum layer 2 solution, joining Germany-based Deutsche Bank on a similar path.

Financial giants BlackRock and Fidelity are tokenizing assets on Ethereum, while Visa and Mastercard have tapped Ethereum for their Web 3 solutions. Sam Altman’s World Project is pitching tents, with the network with Coinbase’s Base, racking impressive numbers as an L2 and graduating to Stage 1 EVM rollup.

Trump’s WLFI holds 94% of its cryptocurrency holdings on Ethereum, while Circle is opting to house a significant amount of its stablecoin in Ethereum. A combination of heavy institutional backing will prop Ethereum price for a rally in the short term.

A Massive Rebrand For Ethereum Is Underway

Aware of the barrage of criticism over falling metrics and bland price performance, developers are keen on a network upgrade. Dankrad Feist has warned that Ethereum is in danger if it fails to scale its gas limit by 100X over five years.

On the flipside, Vitalik Buterin is mooting a proposal to revamp Ethereum akin to Bitcoin’s simplicity in a move that may positively impact the ETH price. Charles Hoskinson has predicted that the network will crash in 15 years, citing layer 2 cannibalization and its outdated technology.

The post Ethereum Price Recovery Soon? Key Factors Point To ETH Bull Rally Ahead appeared first on CoinGape.

A large XRP transfer worth over $64 million by a Ripple whale has caught market attention as analysts suggest a possible bullish breakout. The transaction involved 29,532,534 XRP moving from an unknown wallet to Coinbase, hinting at renewed activity among large holders.

As XRP continues to trade above key support levels, traders are watching the market closely. Technical signals and whale movements are adding to speculation about a potential rally in the coming days.

Ripple Whale Activity Increases Ahead of Market Move

On-chain data has confirmed that Ripple whales have increased their positions. According to Santiment, wallets with 10 million to 100 million XRP tokens added over 200 million XRP last week.

This rise in accumulation by Ripple whales is seen as a possible move by institutional investors preparing for a price shift. At the same time, 23% of U.S. crypto investors now hold XRP, making it one of the most recognized tokens in the country.

Moreover, with the XRP ETF approval odds rising to 80% according to Polymarket, investor interest is rising. In addition, the Proshares XRP ETFs are supposed to launch on May 14 has boosted optimism of XRP price reclaiming $3.

The recent $64 million transfer into Coinbase has added to this outlook. Some analysts believe this move signals confidence by whales, who often act ahead of broad market trends. If true, the token could be preparing for a breakout toward key resistance zones.

XRP Price Action Signals Bullish Outlook

XRP is currently trading around $2.20 after recovering from a recent dip to $2.15. The price dropped on April 30, which triggered $13.9 million in long liquidations compared to just $1.49 million in short liquidations.

Crypto analyst Javon Marks commented on the situation, noting, “With lower timeframes confirming bull signals, another upside move can be in the works for XRP.”

Following the drop, the token’s futures open interest declined by about 4%, which may show traders adjusting their risk. Despite this, XRP price remains above its 20-day simple moving average (SMA), which is now seen as an important support level at $2.1677.

The upper Bollinger Band at $2.3082 is now a key resistance. If XRP price closes above this level with high volume, a push toward $2.50 or $2.80 is likely.

Momentum Indicators Show Mixed Signals

The Relative Strength Index (RSI) is currently at 52.44. It remains in the neutral zone but is slowly increasing, which may suggest building buying interest. The RSI average is at 54.08, and the small divergence between these levels is being monitored closely.

XRP/USD 1-day price chart (Source: TradingView)

The Chaikin Money Flow (CMF) is at -0.13, indicating some capital outflows, but it remains near the neutral line of 0.00. If the CMF moves into positive territory, it would signal a return of buyer strength in XRP price.

The Bollinger Bands have also narrowed, which often suggests a breakout could happen soon. Traders are now watching for price movement above $2.31 with rising volume, which would support the bullish scenario.

The post Ripple Whale Moves $64M As Analyst Predicts XRP Price Bullish Breakout appeared first on CoinGape.

Riches are found in reactions—your reactions to changes in the markets. By this, I mean that if you spot a change in money flowing from one asset class to another, one sector to another, one industry to another, before the masses notice, you will be rewarded handsomely. My experience has been that your profits will accumulate dramatically and consistently.

A fine example of this principle in the corporate arena is the global footwear and accessories retailer, Aldo. The company has 1,600 stores in 80 countries and is immensely profitable. Their secret sauce: quick reactions to market trends. When they identify a change in fashion trends, they’re 50 percent quicker than their competition in designing, producing and delivering the hottest styles. Yes, fifty percent faster, and that’s gold to their bottom line.

This can be your secret sauce to investment profits as well. Your personal portfolio of ChartLists is the equivalent of Aldo’s design department, production department, and delivery department all bundled together. It facilitates quick reactions to current observable stock market opportunities.

In simplistic terms, your personal collection of ChartLists is like giving a runner a bicycle or giving a Jeep driver a Porsche. ROI (return on investment of your time and efforts) becomes supercharged. Your ChartLists allow you to become a “force of consistency.” They will also help you embrace one of Charlie Munger’s key investment tenets, “Try to be consistently not stupid.”

To achieve this end, I humbly suggest that you could best start with the Stock Market Mastery ChartPack.

Assembling your portfolio of ChartLists is analogous to building your custom dream house. There are sensational books of checklists that systematically ask you a comprehensive series of questions and bring up features you should consider. The end result should be a custom home you love, that fits you perfectly, and that accommodates your unique lifestyle. Think of the Stock Market Mastery ChartPack, then, as an extensive checklist—a buffet of pre-populated and organized ChartLists, from which you build your own custom collection of ChartLists that fits your investing methodology perfectly and facilitates your personal Investor Self. These 80 ChartLists are carefully structured, all pre-populated with expertly designed charts and a carefully-crafted organization to maximize your precious time and insights. Indeed, nearly all the informational breadcrumbs the market has to offer will be made clear to you and offer you a profitable trail to follow. Your reflexes and reactions just got supercharged. It is that easy.

Trade well; trade with discipline!

Gatis Roze, MBA, CMT

StockMarketMastery.com

With the major averages logging a strong up week across the board, and with the Nasdaq 100 finally retesting its 200-day moving average from below, it can feel like a challenging time to take a shot at winning charts. You may ask yourself, “Do I really want to be betting on further upside after an incredibly strong April?”

When the macro environment feels less certain, I find it’s helpful to go back to tried-and-true technical analysis approaches. By identifying stocks with constructive chart patterns, we can hopefully focus our attention on names that could do well regardless of the overall market movements in the coming weeks.

With that bottom-up investing justification in mind, let’s review three recent earnings names that are showing strong technical profiles going into next week.

Visa Inc. (V)

Both Visa (V) and Mastercard (MA) reported earnings, and both stocks experienced an upside follow-through after their quarterly report. Visa has been pounding out a consistent pattern of lower lows and lower highs since the end of February, but this week appears to have broken that downtrend pattern.

After Tuesday’s earnings release, Visa completed a move out of the downtrend phase by breaking trendline resistance using the major peaks from February and March. Wednesday’s up day pushed V back above the 50-day moving average, a level which had repelled a previous breakout attempt in mid-April. MA has now broken above its late March high, and a similar move next week would suggest a retest of all-time highs for Visa.

Coca Cola Co. (KO)

The Consumer Staples sector pulled back this week, and leading names in the sector, such as Coca-Cola (KO), experienced a brief drop post-earnings. KO is demonstrating a cup-and-handle pattern, although we’ve not seen the breakout that would serve to confirm a bullish outlook.

We’ve used the Annotations tool to draw a rectangle marking the resistance zone from the September 2024 peak. Subsequent peaks in March and April 2025 have retested this same range, forming the cup-and-handle pattern which often precedes a strong upthrust. The trigger for this pattern is a confirmed break above the rim of the cup, and, with this week’s pullback, investors will have to wait for this bullish confirmation.

We’ve noted the bearish momentum divergence in recent months, with the higher price highs in March and April marked by weaker RSI peaks. With this bearish divergence clearly signalling a weaker momentum profile, we would need to see a valid break above $74 on stronger RSI readings to negate the divergence and confirm an upside breakout.

CME Group Inc. (CME)

Since I discussed the exchanges with Jay Woods on my Market Misbehavior podcast back in February, I’ve been following the resilient uptrend of higher highs and higher lows. The daily chart features a series of consolidation patterns followed by upside breakouts that have led to further gains.

This is the kind of chart that I think about when someone asks, “But if you’re buying the new highs list, isn’t that too late?” The chart of CME shows that new highs often lead to even more new highs. And when a stock like CME Group keeps pulling back to an ascending 50-day moving average, I’m reminded the essence of trend-following is to remain invested in charts that continue to work.

In the immortal words of legendary technical analyst Paul Montgomery, “The most bullish thing the market can do is go up!”


I had the pleasure of heading back into the StockCharts TV studio this week to shoot the “Top Ten Stocks for May 2025” video with Grayson Roze. Visa was one of the five stocks I contributed. Check out the other nine in this week’s video!

RR#6,

Dave

P.S. Ready to upgrade your investment process? Check out my free behavioral investing course!


David Keller, CMT

President and Chief Strategist

Sierra Alpha Research LLC


Disclaimer: This blog is for educational purposes only and should not be construed as financial advice. The ideas and strategies should never be used without first assessing your own personal and financial situation, or without consulting a financial professional.

The author does not have a position in mentioned securities at the time of publication. Any opinions expressed herein are solely those of the author and do not in any way represent the views or opinions of any other person or entity.

We just wrapped up a busy week jam-packed with key economic data and big tech earnings. And we have some positive news: the market held up pretty well. May is off to a good start.

Strong earnings from META Platforms (META) and Microsoft (MSFT) gave the stock market a boost. Together, their strong performance helped the Nasdaq Composite ($COMPQ) break above its 50-day simple moving average (SMA).

On Friday, the rally got an extra shot in the arm from a better-than-expected jobs report—177,000 jobs added vs. 135,000 expected. That helped fuel a market-wide rally, with all the major indexes ending the week in positive territory. The Dow Jones Industrial Average ($INDU) closed up 1.46%, the S&P 500 ($SPX) up 1.42%, and the Nasdaq Composite ($COMPQ) up 1.41%.

A quick glance at the Equities panel (US Indexes tab) in the Market Summary page shows that the S&P 500, Dow Industrials, Russell 1000, and the Wilshire 5000 had nine consecutive up days. This is quite the reversal after trade war outcomes spooked investors. The weekly streak isn’t too shabby either, with many indexes displaying four consecutive up streaks. More indexes are now trading above their 50-day moving averages compared to a few days ago.

What Does This Mean Going Forward?

After a negative statistic in the Q1 GDP growth, the strong jobs report put recessionary fears in the rearview mirror. However, this also lowers the chances of the Federal Reserve cutting interest rates in the May FOMC meeting. And looking at the CME FedWatch Tool, the probability of a rate cut in June has dropped to 36.4%, so it may be July before we see a rate cut. But this scenario could change between now and June.

Does this week’s price action mean the equity market is reversing? One thing is clear: The situation is much more positive than it was three weeks ago. But to get an objective view, it’s best to focus on the charts.

The Technical PoV

The daily chart of $SPX below shows that Friday’s close basically wipes out the “post Liberation Day” losses. Essentially, all the volatile action that took place in the last month was an emotional reaction to the uncertainty that investors were battling against. It was an emotional roller coaster. Now that the S&P 500 is back to the high of April 2, does it mean things have returned to business as usual?

FIGURE 1. DAILY CHART OF S&P 500. The index closed at around the same level it did on Liberation Day. Chart source: StockCharts.com. For educational purposes.

Seasonally, May is a good month in the stock market, as are June and July. You can see this in the seasonality chart of the S&P 500. The data supports some of the price action we’re seeing, especially among sectors and industry groups.

Sector Snapshot

All 11 S&P sectors closed in the green on Friday. For the week, Industrials, Technology, and Financials were the leading sectors. It’s interesting to note that Friday’s leading sector, Financials, is showing signs of recovery after the April fall. The daily chart of the Financial Select Sector SPDR (XLF) shows the ETF trading above its 50- and 200-day SMAs. Its relative strength index (RSI) is also rising.

FIGURE 2. DAILY CHART OF XLF. The ETF broke above its 50-day moving average and its relative strength is also rising. Chart source: StockCharts.com. For educational purposes.

Of the three, the Technology sector is technically the weakest. It’s trading below its 200-day SMA, and its 50-day SMA is below its 200-day SMA. To see strength return to the broader market, the Technology sector needs show technical strength.

The Nasdaq Composite Bullish Percent Index ($BPCOMP) is at 46.52. It showed a reversal from a level just above 20 and crossed above 30, indicating a bull alert. A cross above 50 would be a favorable bull signal.

FIGURE 3. NASDAQ COMPOSITE BULLISH PERCENT INDEX. After a sharp reversal from above 20, $BPCOMPQ crossed above the 30 level and is approaching the 50 level. Chart source: StockCharts.com. For educational purposes.

Keep an eye on this chart, since a break above 50 could be an early signal of improving breadth in the Nasdaq Composite.

At the Close

While the stock market’s price action seems to have regained some of its momentum, there needs to be more confirmation to suggest a trend reversal. Keep an eye on the charts of the broader indexes, sectors, and the BPIs. Look for technical indicators to confirm the rally’s strength and keep an eye on interest rate expectations.


End-of-Week Wrap-Up

  • S&P 500 up 2.92% on the week, at 5686.67, Dow Jones Industrial Average up 3.0% on the week at 41,317.43; Nasdaq Composite up 3.42% on the week at 17,977.73.
  • $VIX down 8.86% on the week, closing at 22.64.
  • Best performing sector for the week: Industrials
  • Worst performing sector for the week: Energy
  • Top 5 Large Cap SCTR stocks: Palantir Technologies, Inc. (PLTR); Duolingo Inc. (DUOL); Summit Therapeutics PLC (SMMT); MicroStrategy (MSTR); Roblox Corp (RBLX)

On the Radar Next Week

  • Earnings season continues with Berkshire Hathaway (BRK-B), Palantir Technologies (PLTR), Taiwan Semiconductor Manufacturing Company (TSM), Novo Nordisk (NOVO-B.CO), Ford (F), Advanced Micro Devices (AMD), and several others reporting.
  • ISM Services PMI
  • Fed Interest Rate Decision/Press Conference
  • Fed speeches from Kugler, Goolsbee, Waller, Williams, and others on Friday

Disclaimer: This blog is for educational purposes only and should not be construed as financial advice. The ideas and strategies should never be used without first assessing your own personal and financial situation, or without consulting a financial professional.

I feel like the short-term risk is turning once again and I’ll explain why in my analysis below. Please don’t misunderstand. I suggested a bottom was in place a few weeks ago and I LOVE what has been happening in terms of manipulation/accumulation and I LOVE the fact that we were able to quickly regain both the 20-day EMA and 50-day SMA on our major indices.

However, here are the four major indices and where they’re at currently on their respective charts and their next key overhead resistance levels:

Dow Jones

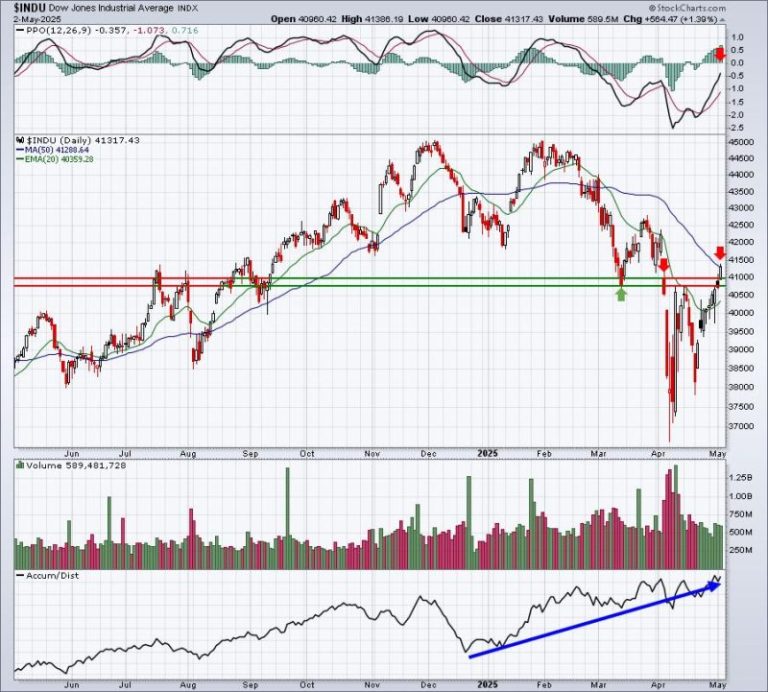
We did manage to close just above the 50-day SMA here, but the Dow Jones still appears vulnerable to me. Given the fact that the S&P 500 has room to run up to what is now major price resistance at 5782, I could see the Dow Jones moving a bit higher to challenge the late-March high at approximately 42750. That could serve as a neckline.

S&P 500

20-day EMA resistance? No problem, went right through. Gap resistance 5500? Ditto. 50-day SMA resistance. Ditto. This rally has been impressive. Key levels of price resistance have failed and this tells me that we’re not going to violate the low at 4835. It’s set in stone, in my opinion. There are still a couple of key resistance levels on the S&P 500 that we’ll have to deal with next week. The first will be the early-April rebound attempt that failed near 5700. Today’s intraday high was 5700. The next one, however, will be the biggest on the chart and that’s where we last failed in late March – at 5782.

NASDAQ 100:

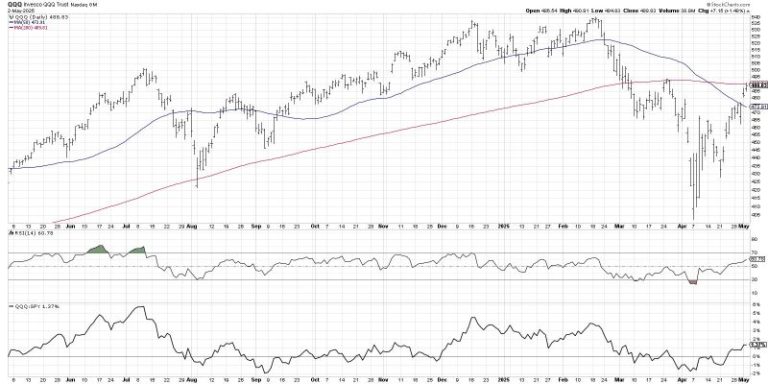
Looks similar to the S&P 500, but I did add the RSI to this chart. During downtrends, RSI 60 tends to be rather big resistance. We see many rallies fail at or near that level. The NDX just crossed RSI 60….barely. At our Friday intraday high, the NASDAQ 100 pulled within 100 points (less than 0.5%) of the late-March high near 20250. I don’t know if we turn here or not, but I do know the risks are elevated.

Russell 2000:

The 197 level offered great price support on multiple occasions, so when we see a heavy-volume breakdown like we saw in early April, we should recognize how important it is to clear that same price resistance on the way back up. We did so on Friday with gusto. I absolutely LOVE the sudden accumulation that’s taken place in the IWM. I believe that will result in a much larger move at some point later this year. But are we due for another round of selling first, perhaps at upcoming price resistance levels marked above? We’ll soon find out.

Be careful ahead, especially if a rising-volume, reversing candle prints on our major indices sometime next week.

Sentiment

Check out this 5-day SMA of the equity only put call ratio ($CPCE):

We just hit 0.55, showing the most complacency we’ve seen in the past 5 weeks or so. Extreme low readings have previously marked corrections and/or cyclical bear markets and that was one key topping indicator that I discussed back in January/February. Other prior moves down to 0.55 have also resulted in short-term tops. I thought the current .55 reading was worth pointing out for this reason.

Seasonality could also play a role. Early May (through the 5th) tends to provide historical tailwinds, but the middle part of May (6th through 25th) has a history of being rather challenging. The 5th is Monday, so given everything I’ve discussed above and knowing that our bullish seasonal window could soon be closing, watch for a potential reversing candle as a sign to think about reducing risk (covered calls, S&P 500 puts for insurance, moving to cash, etc.).

I’m not ready to definitively call a short-term top here, but I do want to point out that the SHORT-TERM risks of being long right now are growing. Do with that what you may.

If you’d like to follow more articles of mine, please CLICK HERE to join the tens of thousands who’ve already subscribed to our FREE EB Digest newsletter. There is no credit card required and you may unsubscribe at any time.

Happy trading!

Tom