Author

admin

Browsing

XRP price continues to consolidate for more than three consecutive months. This range tightening has reeled in investors betting on a breakout direction. As a result, nearly $60 million worth of long positions will be wiped if price moves just 4%. With the Fed meeting scheduled for 2 pm ET today, investors can count of increased volatility. 

Liquidation Risk Amplifies for XRP Traders

XRP price prediction remains flat as the token is stuck in a range, extending from $2.06 to $2.60. Typically, range-bound movement attracts more capital from investors attempting to catch a breakout trade. The same is the case for Ripple’s XRP, as confirmed by data from Coinglass. Nearly $60 million worth of bulls will face liquidation if XRP price drops just 4% and sweeps $2.063.

XRP Liquidation Map

Will XRP drop lower or climb higher ahead of the key fed meeting? 

What to Expect From Fed Meeting Today

The market consensus is that the Federal Reserve Chariman Jerome Powel and its members will keep the target rate unchanged, in the 4.250% to 4.50% range. This outcome is already priced in. Despite this, there will be volatility that could cause short-term pain on both sides as noted above.

All eyes are on the Federal Open Market Committee (FOMC), where any change in Powel’s tone or guidance for the future could impact XRP, which is a risk-on asset like the stock or the crypto markets.

If the Fed hints at easing or rate cuts, it could cause Bitcoin price rally that could help alleviate the bearish pressure on altcoins, including XRP. Let’s explore XRP price prediction and key levels to watch using technical analysis. 

XRP Price Prediction & Analysis Ahead of Fed Meeting

XRP price has traded within the $2.06 to $2.60 for three months, and about 70% of the volume was traded in this range. Interestingly, the liquidation risk for long positions is at the range low of the aforementioned value area.

The outlook for altcoins remains bullish, with $2.41 as the first key hurdle, also known as High Volume Node (HVN). Beyond this, XRP price needs to overcome the range high at $2.60 to reach the next HVN at $3.11. 

XRP/USDT 1-day chart

On the other hand, weakness in Bitcoin (BTC) due to the Fed meeting could invalidate the above bullish outlook. A breakdown of $2.06 could catalyze a selling spree from long positions. In that case, the Low Volume Node (LVN), XRP price could slide swiftly from $1.87 to $1.56.

The post XRP Price Prediction: 4% Move Risk $60M Liquidation Ahead of Fed Meeting appeared first on CoinGape.

In the latest development within the Ripple ecosystem, the XRP token is on the radar for a potential game-changer. With the New Hampshire Digital Asset Reserve law passed, experts predict XRP’s inclusion in the reserve, sparking widespread enthusiasm.

Is a strategic XRP reserve possible? Of course, yes, say legal experts. However, there’s still a condition that the token needs to meet.

This article explores the possibility of an XRP reserve and its requirements. Let’s dive into the details and what this could mean for Ripple’s future.

Strategic XRP Reserve on the Horizon? Expert Weighs In

In response to the recent HB 302 Bill passed by New Hampshire, legal expert Fred Rispoli has shared insights on the potential adoption of Ripple’s XRP as a crypto reserve. The law authorizes the State Treasurer to invest in cryptocurrencies with a market cap exceeding $500 billion—a criterion currently met only by Bitcoin. Rispoli wrote on his X post, “According to this law that was passed, if XRP hits a $500B market cap this year then it is also eligible for the NH digital asset strategic reserve in 2026!”

According to Rispoli’s X post, XRP is likely to be adopted as a Strategic Reserve in New Hampshire if the token’s market cap surges past $500 billion. Currently ranked 4th with a market cap of $125.25 billion, this milestone seems ambitious. However, the coin’s growing demand and adoption suggest it’s not entirely out of reach.

Government Bonds: A Revolutionary Idea

In a parallel development, Black Swan Capitalist proposed a bold concept involving XRP. He sparked a lively debate on introducing XRP-backed government bonds. According to the proposal, the US government could issue debt instruments denominated in Ripple’s coin, offering investors a fixed yield and redemption at maturity. This move aims to modernize sovereign debt markets with blockchain technology for improved efficiency and transparency.

This increased use case, coupled with the growing institutional adoption of the Ripple token, significantly bolsters Fred Rispoli’s prediction. The speculation is further intensified by emerging reports that US banks are exploring XRP adoption.

The post XRP Could Qualify for U.S. Strategic Reserve; Here’s How appeared first on CoinGape.

In this competitive crypto market, several turn their heads to crypto prediction tools to ease their trading journey. Though, traditional crypto prediction markets often promise simplicity, they actually deliver cluttered interfaces, endless wallet approvals, and confusing user flows. These layers of friction can frustrate even seasoned DeFi users, making fast-paced predictions feel like a slow, technical grind. But the scenario is changing with this telegram bot.

Hardbeed looks to solve all the aforementioned complaints. Instead of building more complex apps, some projects like this one are exploring lightweight, non-custodial models that reduce friction and shift the user experience away from traditional web interfaces.

It offers a stripped-down experience with no user interface, no wallet connections, no deposits, and no accounts. Instead, everything happens through two smart contract addresses, with a read-only Telegram stats bot available for real-time updates.

Hardbeed—A prediction protocol without a platform

Hardbeed offers one-minute binary options on the ETH/USDC price with no website to visit or app to install. To make a prediction, users simply send ETH from their own wallet to one of two designated smart contract addresses: one for “Up,” the other for “Down.” There’s no wallet connection, no approvals, and no deposits in the traditional sense. The only transaction you make is your on-chain prediction.

At the end of each round, the outcome is determined using on-chain Uniswap v3 data, and payouts are resolved automatically by the smart contract with no off-chain intervention. If the prediction is incorrect, there is no further action as the loss is final while no funds are retained by the protocol.

All ETH at stake is pooled together, and the winners split the pot proportionally based on the size of their action. The fewer people who guessed correctly, the larger each winner’s share. Users will always need to pay gas for each transaction.

Telegram bot as the control center

Since Hardbeed does not feature a traditional frontend, the only real interface is a familiar Telegram bot. Technically speaking, it isn’t a bot in the interactive sense. It’s just there for stats. Users can check how much ETH is staked on each side of the current round, see how much time is left, and monitor recent results, much like at a roulette table.

There’s no registration, no KYC verification process, and no accounts to set up. The trustworthiness of actions is backed by Ethereum smart contracts, which means every action is public, auditable, final, and fair.

What’s most appealing about Hardbeed is the way it’s reinventing trust in a sector where scams and theft are common. Hardbeed doesn’t need slick marketing or certifications from sketchy jurisdictions to convince you it can be trusted. Instead, you place your trust in Ethereum itself. You don’t deposit funds, click any buttons, or don’t wait days for withdrawals. All you do is send ETH, and the result is final – win or lose. It’s a simplification of the prediction experience that aligns more closely with crypto’s original ethos.

Source: Telegram

A stripped-down user experience

For more advanced DeFi users, Hardbeed can be described as refreshing. There’s a certain degree of simplicity in making an on-chain prediction this way. There’s no need to worry about misclicking a UI element, connecting the wrong wallet, or wondering if your balance is stuck in limbo.

At the same time, the experience can be intimidating. There’s no “are you sure?” prompt. No timer bar. No feedback unless you check the bot or manually track your transaction. One might say the learning curve isn’t steep, but it’s sharp, especially for users who’ve only interacted with polished Web3 interfaces designed by marketing teams.

There are, of course, some drawbacks, although through no fault of Hardbeed. Since each round is just one minute, there’s very little room for error. If you send a transaction late, you might miss the round entirely. If gas is too low, your action may not be confirmed in time.

These quirks likely won’t bother more experienced users, though they may be seen as part of a learning curve for users newer to on-chain tools. That said, this is a reasonable trade-off for a system with simplicity and decentralization at its core.

Who is Hardbeed meant for?

Hardbeed’s target user seems clear: crypto natives who value autonomy, transparency, and speed over visual polish. These are likely individuals who would rather read a contract than browse a UI.

One would be forgiven for assuming Hardbeed is exclusive to tech maximalists. But anyone with a basic understanding of ETH transfers and on-chain mechanics can try it out. Since there’s no signup, no approvals, and no minimum balance requirement beyond the prediction itself, users can walk away if they aren’t pleased with the experience after just one minute.

The project launched in January 2025 and has already seen daily cumulative volumes around 14,500 ETH. That suggests a varied user base, although one would assume a few whales account for the majority of transactions. Still, the system is built to be fair for users of all kinds.

Risks and realities

It’s worth emphasizing that binary options are high-risk. Each round is an all-or-nothing kind of a deal. This isn’t where you can fold your hand after posting a big blind.

Sure, the platform removes a lot of the usual friction and middlemen, but it doesn’t remove the chance of rapid losses, especially in a one-minute cycle, which might feel like an hour. During periods of high volatility, even 10 seconds can feel like an eternity.

Since every prediction is a separate on-chain transaction, Ethereum network fees can add up quickly, especially for smaller amounts, but this is a limitation of the blockchain, not the platform itself. And while the platform requires no custodial deposits, the minimum action is dynamic, tied to the current gas price, with a floor of around 50,500 gwei * gas.

Final thoughts

Hardbeed is a fast and transparent minimalist’s binary options protocol. For the kind of user who sees too many platforms as overbuilt and over-trusted, it may feel like the most stripped-down approach to binary predictions yet.

Hardbeed removes the noise and replaces it with something rare in prediction protocols: clarity. In doing so, it offers a new model that proves fairness doesn’t require flair. For those comfortable with the risks, it’s setting the standard for what on-chain prediction protocols can achieve.

The post Tired Of Complex Crypto Prediction? Check Hardbeed—A No-UI Telegram Bot That Is Changing The Market appeared first on CoinGape.

As the two nuclear nations – India and Pakistan – engaged in a military confrontation on Tuesday, Solana-based token under the name of ‘Operation Sindoor’ has started floating in the market, as investors seek to ride the momentum. These tokens have been majorly circulating on decentralized exchanges and trading up 24% with trading volumes of just over $20K.

Newly Created ‘Operation Sindoor’ Solana Tokens Raise Concerns

A series of newly minted crypto assets, named after themes like “Operation Sindoor” and “Pahalgam,” have surfaced on the Solana blockchain. Most of these tokens have low market capitalizations and minimal trading volumes, with some linked to “Operation Sindoor” appearing just hours ago, just after India launched precision strikes on Pakistan terror camps on Tuesday.

Industry analysts have noted the lack of key indicators of legitimacy for these assets. Many tokens fail to provide essential documentation such as whitepapers, official websites, or active social media channels, which are typically expected from credible projects.

Major market events tend to create hype in the early hours, with some players capitalizing on it. We have often seen this with Solana-based meme coins launched after celebrities or things. However, the liquidity usually dries up after the event fades, and retail players need to maintain caution while riding these trends.

Crypto Market Reaction in the Aftermath

In the aftermath of these attacks, the crypto market remains largely stable today while investor optimism picks up once again ahead of today’s FOMC meeting. There’s a 95% probability that the Fed rate cuts won’t happen during this meeting, however, the market seems to be looking past that.

As of press time, Bitcoin price is trading 3.43% up at $96,988, as investors await a potential breakout to $100K levels and beyond to fresh all-time highs. On the other hand, altcoins have also gained momentum with top players gaining 3-5% today, while awaiting the passing of crypto legislation by the US Senate.

The post Solana-Based Operation Sindoor Token Gains Traction Amid India’s Missile Strike on Pak appeared first on CoinGape.

Amazon’s Zoox issued a software recall for 270 of its robotaxis after a crash in Las Vegas last month, the company said Tuesday.

The recall surrounds a defect with the vehicle’s automated driving system that could cause it to inaccurately predict the movement of another car, increasing “the risk of a crash,” according to a report submitted to the National Highway Traffic Safety Administration.

Zoox submitted the recall after an April 8 incident in Las Vegas where an unoccupied Zoox robotaxi collided with a passenger vehicle, the NHTSA report states. There were no injuries in the crash and only minor damage occurred to both vehicles.

“After analysis and rigorous testing, Zoox identified the root cause,” the company said in a blog post. “We issued a software update that was implemented across all Zoox vehicles. All Zoox vehicles on the road today, including our purpose-built robotaxi and test fleet, have the updated software.”

Zoox paused all driverless vehicle operations while it reviewed the incident. It’s since resumed operations after rolling out the software update.

Amazon acquired Zoox in 2020 for over $1 billion, announcing at the time that the deal would help bring the self-driving technology company’s “vision for autonomous ride-hailing to reality.” However, Amazon has fallen far behind Alphabet’s Waymo, which has robotaxi services operating in multiple U.S. markets. Tesla has also announced plans to launch a robotaxi offering in Austin in June, though the company has missed many prior target dates for releasing its technology.

Zoox has been testing its robotaxis in Las Vegas, Nevada, and Foster City, California. Last month, Zoox began testing a small fleet of retrofitted vehicles in Los Angeles.

Last month, NHTSA closed a probe into two crashes involving Toyota Highlanders equipped with Zoox’s autonomous vehicle technology. The agency opened the probe last May after the vehicles braked suddenly and were rear-ended by motorcyclists, which led to minor injuries.

This post appeared first on NBC NEWS

Investing in rare earth minerals can seem tricky, but there are a variety of rare earth stocks and exchange-traded funds (ETFs) available for metals investors.

The rare earth sector may seem daunting, as many elements fall under the umbrella, and the 17 rare earth elements (REEs) are as diverse as they are challenging to pronounce.

The group is made up of 15 lanthanides, plus yttrium and scandium, and each element has different applications, pricing and supply and demand dynamics. Sound complicated? While the REE space is undeniably complex, many investors find it compelling and are interested in finding ways to get a foot in the door.

Read on for a more in-depth look at the rare earth metals market and the many different types of rare earth minerals, plus rare earth stocks and ETFs you can invest in.

In this article

    What are the types of rare earth minerals?

    There are a number of ways to categorize and better understand rare earths, which will help you know which companies to invest in based on what they’re targeting.

    For example, they are often divided into “heavy” and “light” categories based on atomic weight. Heavy rare earths are generally more sought after, but light REEs are important too.

    Rare earths can also be grouped together according to how they are used. Rare earth magnets include praseodymium, neodymium, samarium and dysprosium, while phosphor rare earths — those used in lighting — include europium, terbium and yttrium. Cerium, lanthanum and gadolinium are sometimes included in the phosphor category as well. For a detailed breakdown of rare earth uses, check out our guide.

    One aspect that is common to all the rare earths is that price information is not readily available — like other critical metals, rare earth materials are not traded on a public exchange. That said, some research firms do make pricing details available, usually for a fee, including Strategic Metals Invest, Fastmarkets and SMM.

    What factors affect supply and demand for rare earths?

    As mentioned, each REE has different pricing and supply and demand dynamics.

    However, there are definitely overarching supply and demand trends in the sector. Most notably, China accounts for the vast majority of the world’s supply of rare earth metals. As the world’s leading producer, the Asian nation accounted for roughly 70 percent of rare earths production in 2024, or 270,000 metric tons (MT), with the US coming in a very distant second at 45,000 MT. After the US, Myanmar is the third largest rare earths producer with total output of 31,000 MT last year. On top of that, China is also responsible for 90 percent of refined rare earths output.

    The strong Chinese monopoly on rare earths production has created problems in the sector in the past. For instance, prices in the global market spiked in 2010 and 2011 when the country imposed export quotas.

    The move sparked a boom in global rare earth metals exploration outside of China, but many companies that entered the space at that time fell off the radar when rare earths prices eventually sank again. Molycorp, once North America’s only producer of rare earths, is a notable example of how hard it is for companies to set up shop outside China. It filed for bankruptcy in 2015. But the story didn’t end there — MP Materials (NYSE:MP), the company that now owns Molycorp’s assets, went public in mid-2020 in a US$1.47 billion deal, and a year later was a US$6 billion company.

    MP Materials is now the western hemisphere’s largest rare earths miner, putting out high-purity separated neodymium and praseodymium oxide; a heavy rare earths concentrate; and lanthanum and cerium oxides and carbonates.

    Concerns about China’s dominance are ongoing as the US/China trade war continues and as supply chain stability grows in importance. The Asian nation has tightly controlled how much of its rare earths products make it into global markets through a quota system initiated in 2006.

    US President Donald Trump’s high tariffs targeting Chinese goods has resulted in China enacting further rare earth export restrictions. In April 2025, the Government of China placed strict export controls on samarium, gadolinium, terbium, dysprosium, lutetium, scandium and yttrium — all crucial for the production of electric vehicles, smartphones, fighter jets, missiles and satellites.

    Sharing a border with China, Myanmar is the source of at least 70 percent of its neighbor’s medium to heavy rare earths feedstock. With that in mind, it’s not surprising that a temporary halt in Myanmar’s production in late summer of 2023 sent rare earths prices to their highest level in 20 months, as per OilPrice.com.

    Myanmar’s rare earths production experienced further disruptions in late 2024 as the Kachin Independence Army seized two towns in Kachin state, near China’s Yunnan province, that are critical suppliers of rare earth oxides to China.

    Outside of China, one of the world’s leading rare earths producers is Australian company Lynas (ASX:LYC,OTC Pink:LYSCF), which sends mined material for refining and processing at its plant in Malaysia. In 2023, Japan Australia Rare Earths, a joint venture between the Japan Organization for Metals and Energy Security and Sojitz (TSE:2768), inked an agreement to invest AU$200 million in the production and supply of heavy rare earths from Lynas.

    This has allowed the mining company to expand its light rare earths production and begin production of heavy rare earths. Lynas brought its large-scale downstream Kalgoorlie rare earths processing facility online in November 2024. According to its H1 2025 fiscal year results, the company’s neodymium and praseodymium (NdPr) production volume increased by 22 percent.

    In the US, MP Materials is making good use of US$58.5 million awarded in April to support construction of the first fully integrated rare earth magnet manufacturing facility in the US. The funding is part of the Section 48C Advanced Energy Project tax credit granted by the Internal Revenue Service, Department of Treasury and Department of Energy.

    The Fort Worth, Texas, magnet facility began producing the NdFeB magnets crucial for EVs, wind turbines and defense systems at the start of 2025. First commercial deliveries are expected by the end of the year.

    Looking at demand, many analysts believe the need for rare earths is set to boom on accelerating growth from top end-use categories, including the electric vehicle market and other high-tech applications.

    As an example, demand for dysprosium, a key material in steel manufacturing and the production of lasers, has grown as countries increase their steel standards. Aside from that, rare earths have long been used in televisions and rechargeable batteries, two industries that accounted for much demand before the proliferation of new technologies. Other rare earth metals can be found in wind turbines, aluminum production, catalytic converters and many high-tech products.

    As can be seen, securing rare earths supply is an increasingly important issue. In addition to traditional rare earths mining, there has been growth in the rare earths recycling industry, which aims to recover REE raw materials from electronics and high-tech products in order to reuse them in new ways.

    Exploring and extracting rare earth materials from deep-sea mud is one of the newest recovery methods, although deep sea mining of mud and nodules comes with significant environmental concerns. However, it is gaining traction as more mining companies look offshore for resources and US President Trump pushes for fast tracking of deep-sea mining permits.

    How to invest in rare earth minerals

    Investors are increasingly wondering how they can invest in rare earth metals as demand ramps up and the US-China trade war has caused further concerns about rare earth supply chains. The possibility of higher rare earth prices in the coming years is one of the catalysts for investors wondering how they can invest in rare earths. As it’s not possible to buy physical rare earth metals, the most direct way to invest in the rare earth market is through mining and exploration companies.

    Investing in rare earth stocks

    While many rare earth minerals companies are located in China and are not publicly traded, there are a variety of rare earth companies listed on US, Canadian and Australian stock exchanges.

    Below is a selection of companies with rare earths assets or operations trading on the NYSE, NASDAQ, TSX and ASX; all had market caps of over $500 million as of April 22, 2025.

      Small-cap REE companies are also listed on those exchanges.

      Here’s a hefty list of junior rare earths stock and companies with rare earths projects. The rare earths stocks on this list had market caps between $5 million and $500 million as of April 22, 2025:

        To learn more about investing in rare earths, check out our stocks lists on the 9 Biggest Rare Earth Stocks in the US, Canada and Australia, Top Canadian Rare Earths Stocks, and the 5 Biggest ASX Rare Earth Stocks.

        Investing in rare earth ETFs

        Rare earth exchange-trade funds (ETFs) offer investors a diversified position in this market space, mitigating the risks of investing in specific companies.

              Securities Disclosure: I, Melissa Pistilli, hold no direct investment interest in any company mentioned in this article.

              Keep reading…Show less
              This post appeared first on investingnews.com

              White Cliff Minerals Limited (“WCN” or the “Company”) (ASX: WCN; OTCQB: WCMLF) is pleased to announce further assay results from the reverse circulation drilling campaign at the Company’s 100% owned Rae Copper Project in Nunavut, Canada.

              • Further assay results confirm and validate the strategy to explore previously untested high-grade zones and vertical depth extension of mineralisation at Danvers
              • Highlights from DAN25008:
                • 175m @ 2.5% Cu & 8.66g/t silver (Ag) from 7.6m, including 14m @ 7.55% Cu & 25.8g/t Ag from 138m
                • the last 60m of the hole averaged 3.9% Cu & 14.96g/t Ag to final depth of 182.88m
                • hole ended in mineralisation with the last 1.5m sample recording 4.46% Cu & 11.58g/t Ag, open at depth
              • DAN25001 returned 52m @ 1.16% Cu & 3.43g/t Ag from surface, including 7.6m at 3% Cu & 9.5g/t Ag from 18.28m
              • Drilling demonstrates potential for significant expansion to historic non-compliant resource. With the initial objectives of Danvers drilling achieved, to begin to understand the significance of this discovery, new drilling data will feed into a maiden JORC compliant mineral resource
              • Mineralisation remains open in all directions. Follow up diamond drilling now being planned to drill out the mineralisation boundaries at Danvers and begin testing of the massive sedimentary structure at Hulk
              • The next five (5) assays along strike from DAN25008 are due in the coming weeks

              “DAN25008 was prioritised for assay due to the abundance of visual sulphides observed during drilling, and these results have underpinned our confidence in those visuals prevalent in the Company’s prior work. We believe this drill hole ranks among the most significant copper intersections globally within the last 50 years and comfortably sits within the top 10 globally reported “grade-metre” copper results.

              This discovery and outstanding results from Danvers is a clear testament to our technical team’s expertise and geological understanding, in particular the professionalism and persistence of Olga Solovieva and Sam Vaughan.

              Our improved geological understanding of the Danvers area indicates a mineralised system that extends from surface over more than 175m vertically and potentially 7km in strike length – both to the northeast and southwest, providing scope for further high-impact intercepts from upcoming drilling. With our work updating the geological understanding at Danvers, we adapted our drill targets and DAN25008 resulted in mineralisation at least 30 metres below historical limits, with the hole terminating in high-grade copper mineralisation – suggesting considerable additional potential at depth. The increase in grade toward the bottom of the hole is encouraging and is validation of our methodology.

              To illustrate the magnitude of this result, the DAN25001 intercept of 52m at 1.2% Cu – a strong result in its own right – now appears modest when viewed alongside the 175m @ 2.5% Cu from DAN25008. In the context of global copper supply constraints, the Company is well positioned to leverage these results with mineralisation from surface, supporting potential open pit mining activities and an open water port less than 80km from the deposit.

              Troy Whittaker – Managing Director

              FURTHER INFORMATION

              Drillhole DAN25008 is an important step in the development of the Danvers copper deposit. An intercept of 175.26m at 2.5% copper is an outstanding result illustrating the continuous mineralisation which commences just below surface at 7.62m downhole. The final 30m of DAN25008 which averages 2.37% Cu and 10.51g/t Ag exists below the trace of historic drilling, effectively extending the known high-grade mineralisation.

              Click here for the full ASX Release

              This post appeared first on investingnews.com

              In this video, Dave reveals four key charts he’s watching to determine whether the S&P 500 and Nasdaq 100 will be able to power through their 200-day moving averages en route to higher highs. Using the recently updated StockCharts Market Summary page, he covers moving average breadth measures, his proprietary Market Trend Model, offense vs. defense ratios, and the Bullish Percent Indexes.

              This video originally premiered on May 5, 2025. Watch on StockCharts’ dedicated David Keller page!

              Previously recorded videos from Dave are available at this link.

              Communication Services Drops to #5

              The composition of the top five sectors remains largely stable this week, with only slight adjustments in positioning. Consumer staples continue to lead the pack, followed by utilities, financials, real estate (moving up one spot), and communication services (dropping to fifth). This defensive lineup persists despite a rallying market, presenting an interesting dilemma for sector rotation strategies.

              1. (1) Consumer Staples – (XLP)
              2. (2) Utilities – (XLU)
              3. (3) Financials – (XLF)
              4. (5) Real-Estate – (XLRE)*
              5. (4) Communication Services – (XLC)*
              6. (6) Healthcare – (XLV)
              7. (7) Industrials – (XLI)
              8. (8) Materials – (XLB)
              9. (11) Technology – (XLK)*
              10. (10) Energy – (XLE)
              11. (9) Consumer Discretionary – (XLY)*

              Weekly RRG

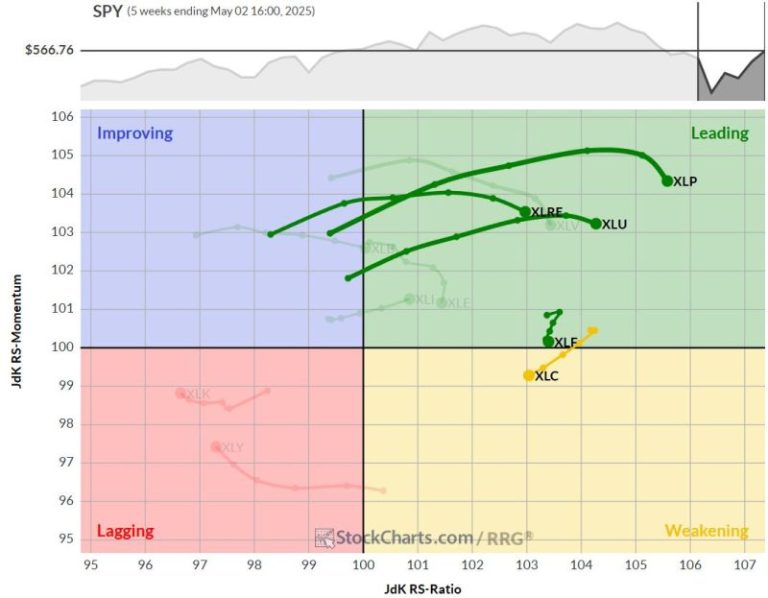
              The weekly Relative Rotation Graph (RRG) paints a picture of potential change on the horizon.

              While staples, utilities, real estate, and financials maintain their positions in the leading quadrant, they show signs of losing relative momentum over the past few weeks.

              Financials, particularly, are teetering on the edge of rolling into the weakening quadrant.

              Communication services have already shifted, now firmly in the weakening quadrant and traveling on a negative RRG heading. This movement explains its drop to the fifth position in our sector rankings.

              Daily RRG

              Switching to the daily RRG, we see a slightly different picture for our top sectors.

              Staples, utilities, real estate, and financials are all positioned in the weakening quadrant, traveling on negative RRG headings.

              This short-term view indicates that we must closely monitor these sectors to determine if they can regain momentum before potentially dropping out of the top five.

              Interestingly, communication services is showing signs of life on the daily chart. Despite falling to the fifth position overall, its tail is now in the improving quadrant and moving toward leading.

              The caveat? It’s a very short tail, close to the benchmark—essentially moving in line with the market. This makes communication services the sector most at risk of losing its top-five status in the near term.

              Consumer Staples

              Consumer staples is bumping up against overhead resistance between $82.50 and $83.

              This hesitation in upward price movement is causing weakness in the RS line, which has started to dip.

              Consequently, the RS momentum line is rolling over. However, the high RS ratio—indicating a strong relative trend—is keeping staples at the top of our list for now.

              Utilities

              Utilities has been flirting with a breakout since the start of 2025, pushing against overhead resistance around $80 about four times already.

              When it breaks, we’ll likely see an acceleration towards the all-time high just above $82.50.

              Like staples, the inability to break resistance is causing a stall in the RS line and a rollover in relative momentum.

              Financials

              After a strong rally off the $42 support level, previously resistance (the old technical adage holds true), financials is now facing a challenge.

              The rally is approaching the former rising support level that marked the uptrend channel. This could cause some hesitation in both price and relative strength.

              The RS line remains within its rising channel, but momentum has waned, causing the green RS momentum line to roll over.

              Real-Estate

              Real estate moved up one position to fourth and is still emerging from a long relative downtrend that began in April 2022.

              The RS ratio line has picked up the relative strength rally that started in early 2025 but is now stalling.

              This has resulted in the green RS momentum line rolling over. On the price chart, real estate is mid-range with room to move higher.

              Communication Services

              Communication services have dropped to the fifth position, but the price chart has an interesting development.

              Last week, the price broke back above the old neckline of a small head-and-shoulders pattern. The fact that we’re now rallying above this neckline could indicate a failed head-and-shoulders pattern—usually a very strong bullish sign.

              However, recent weakness in relative strength has pushed the sector deeper into the weakening quadrant on the RRG.

              This sector must pick up rapidly in the coming weeks to maintain its position in the top five.

              Portfolio Performance

              The defensive positioning of our top five sectors is leading to underperformance as the broader market rallies.

              Currently, we remain at approximately a 3% underperformance compared to SPY just like last week.

              However, from the perspective of sector rotation, we must still consider this rally in the S&P 500 to be temporary.

              The underlying message continues to emphasize defense.

              It’s important to remember that there is always a lagging element in RRGs and this strategy.

              If the market has truly turned, we will see that shift reflected in our sectors, and at some point, we will start to make up the difference.

              These performance gaps can change very rapidly in favor of the RRG portfolio when the market comes under pressure and our defensive sectors start to lead again.

              #StayAlert and have a great week — Julius