Archive

July 2025

Browsing

This opinion piece was submitted to the Investing News Network (INN) by Darren Brady Nelson, who is an external contributor. INN believes it may be of interest to readers and has copy edited the material to ensure adherence to the company’s style guide; however, INN does not guarantee the accuracy or thoroughness of the information reported by external contributors. The opinions expressed by external contributors do not reflect the opinions of INN and do not constitute investment advice. All readers are encouraged to perform their own due diligence.

By Darren Brady Nelson

As an economist, I, perhaps somewhat sadly, have many economist friends. One of them recently alerted me to a post on X that was even a shock to me in the toxic 2020s. That being: “Almost all political donations by Fed employees go to one party. The Fed is already politicized.”

The post had a link to the data supporting this assertion, which was published at OpenSecrets. They are a “501(c)3” devoted to: “tracking money in US politics and its effect on elections and public policy.” Their theme is appropriately “Follow the Money,” as it is for this story.

Political money contributions, since 2016, from those at the Fed, range between 92 to 93 percent for Democrats and 8 to 9 percent for Republicans. As Public Choice economics teaches, it is crucial to “Follow the Money” in politics. Austrian and Chicago schools of economics teach the same for gold.

Gold pricing 101

Gold pricing is often characterized as being driven by “fear and uncertainty,” at least in the short run, including geopolitical fears like war and economic uncertainties such as recession. It is also typically recognized to be an “inflation hedge,” in the long run anyway.

Gold is an asset with a price determined in a 24/7/365 global auction, most often quoted per troy ounce, in the world’s reserve currency of US dollars. New supply plays an unusually small role compared to almost all other commodities, goods or services. Thus, highest bid wins.

Perhaps none of these things about gold, and its price, are new nor surprising. But what might be, despite the end of the gold standard in 1971 and legalization of gold investment in 1974, is that gold is still a shadow currency to fiat ones, especially US dollar, in the ‘always run.’

The annual gold price from 1960 to 2024 is displayed below, as sourced from the World Bank. Rises include: late 1970s; late 2000s; and mid 2020s. Slides include: early 1980s; late 1990s; and early 2010s. Overall growth was: Sum 555 percent; Ave 8.7 percent; Max 98 percent; Min 24 percent; and CAGR 6.8 percent.

Gold yearly growth ($).

Source: World Bank.

Money supply 101

Gold is the inflation hedge, precisely because it is shadow currency. Money supply is the inflation source, precisely because it is fiat currency. As Chicago economist Milton Friedman wrote in Money Mischief (1994): “In the modern world, inflation is a printing-press phenomenon.”

There are multiple money supply measures, such as M0, M1, M2 and M3. M1 includes paper and coin currency held by the general public as well as liquid bank deposits (e.g. checking accounts). M3 includes M1, plus less liquid bank deposits (e.g. savings accounts) as well as “repos.”

Austrian economist Robert Murphy details in Understanding Money Mechanics (2021) just how the Fed’s printing, Treasury bonds and bank loans create US money supply, through open market operations. Since 2008 and 2020, the Fed has expanded to buying and selling just about anything.

Speaking on behalf of the Fed, and all major central banks, the Bank of England wrote in Money Creation in the Modern Economy (2014): “(B)ank lending creates deposits. At that moment, new money is created. (This is) ‘fountain pen money,’ created at the stroke of bankers’ pens(.)”

Annual M1 and M3 money supply from 1960 to 2024 are displayed below, as sourced from the OECD. M3 starts to take off from the mid 1990s. Both blast off in the early 2020s, M1 in part due to redefinition. Combined growth was: Sum 533 percent; Ave 8.3 percent; Max 126 percent; Min 6.4 percent; and CAGR 7.4 percent.

Money yearly growth ($).

Source: OECD.

Gold inflation 101

Christian economist Gary North points out in Honest Money (2011) that businesses have three choices in the face of money inflation: A) profit deflation; B) price inflation; C) quality shrinkflation. Investors have a fourth: D) gold inflation. A, B, and C are all bad options. D is good.

The chart below shows cumulative annual growth of gold versus M1 and M3. Gold performs and protects against both M1 and M3 from 1974 to 2019, even in 2001, but not against M1 from 2020 to 2024. In 2019, gold had a 150 percent lead on M1 and 92 percent on M3. By 2022, it shrunk to 110 percent and 80 percent.

Cumulative yearly growth (percent).

Sources: OECD and World Bank.

A 2020 regression study found: “When the Federal Reserve increases money supply by 1%, gold prices increase by 0.94%.” A 2023 academic paper: “Confirms a long-term relationship between gold price and US M2.” Note that M1’s 2021 redefinition has now made it nearly identical to M1.

Period yearly change (percent).

Sources: OECD and World Bank.

However, the authors of Austrian School for Investors (2015) wrote: “Gold does not correlate with the rate of inflation as such, but with the rate of change of the inflation rate. In order to buttress this hypothesis, we calculated the regression depicted in (the chart below).”

Source: Austrian School for Investors: Austrian Investing between Inflation and Deflation.

In conclusion, as per my Wokenomics 101 (2023) ghost blog, money inflation by: “increasing demand puts upward pressure on price and quantity and downward pressure on quality.” That puts upward pressure on: nominal CPI and GDP statistics; as well as real gold investment and price.

Inflation doesn’t harm all. It helps some. They are the “Bootleggers and Baptists,” as Public Choice economist Bruce Yandle dubbed them in 1983. Bootleggers are crony capitalists, politicians and bureaucrats whose inflated revenue outpaces costs. Baptists are the “useful idiots.”

Thus, “Follow the Money” back to the “inflationistas” of: Big Business; Big Government; and Big Banks. All gain supernormal profits from easy money: one, making more money; two, collecting more money; and three, creating more money. Also, “Follow the Money” when it comes to gold.

And, sadly, there is one policy that is always bipartisan; print more money. But, gladly, gold will always win.

About Darren Brady Nelson

Darren Brady Nelson is chief economist with Fisher Liberty Gold and policy advisor to The Heartland Institute. He previously was economic advisor to Australian Senator Malcolm Roberts. He authored the Ten Principles of Regulation and Reform, and the CPI-X approach to budget cuts.

This post appeared first on investingnews.com

Statistics Canada released June’s consumer price index (CPI) data on Tuesday (July 15). The report showed that year-over-year inflation gained momentum during the month, rising to 1.9 percent from the 1.7 percent recorded in May.

The increase was attributed in part to the 13.4 percent year-over-year decline in gas prices seen in June, as it was a smaller drop than May’s 15.5 percent decrease caused by the removal of the consumer carbon tax.

Other factors contributing to the rise included a 2.7 percent increase in durable goods, with passenger vehicles posting the largest gains at 4.1 percent. Grocery prices also increased 2.8 percent, although they eased off from a 3.3 percent increase in May.

While economists had predicted a larger 2 percent rise in CPI, the figures still make it unlikely that the Bank of Canada will cut its benchmark rate at its next meeting on July 30. Canada’s central bank has cut its interest rates seven times since June 2024, lowering it from 5 percent to 2.75 percent in March.

South of the border, the US Bureau of Labor Statistics also released its June CPI data the same day, reporting year-over-year growth of 2.7 percent, sharply up from the 2.4 percent gain posted in May. On a monthly basis, CPI rose 0.3 percent, also higher than May’s 0.1 percent.

Analysts have attributed the gain to an increase in prices resulting from US President Donald Trump’s tariff policy, as vendors restocked shelves with inventories purchased after tariffs were applied.

Goods and services increased across the board, except for new and used vehicles, which declined by 0.3 percent and 0.7 percent on a monthly basis. Energy rose 0.9 percent, including a 1 percent increase in gasoline prices, a reversal from May’s energy and gas price decreases of 1 percent and 2.6 percent respectively.

The data will likely play a role in what the US Federal Reserve decides during its next rate meeting on July 29 and 30. Economist consensus is that the central bank will continue to hold at the current 4.25 to 4.5 percent range.

Markets and commodities react

In Canada, equity markets were mostly positive this week. The S&P/TSX Composite Index (INDEXTSI:OSPTX) gained 1 percent to close at 27,314.01 on Friday (July 18) and set a new all-time high during the week. The S&P/TSX Venture Composite Index (INDEXTSI:JX) fared even better this week, gaining 2.53 percent to 797.75. However, the CSE Composite Index (CSE:CSECOMP) fell 2.6 percent to 126.84.

As for US equity markets, the S&P 500 (INDEXSP:INX) gained 0.66 percent to close Friday at 6,296.78 and the Nasdaq 100 (INDEXNASDAQ:NDX) climbed 1.35 percent to 23,065.47, with both also setting new record highs during the week. On the other hand, the Dow Jones Industrial Average (INDEXDJX:.DJI) fell 0.1 percent to 44,342.20.

In precious metals, the gold price rose 0.78 percent over the week to US$3,349.66 by Friday at 5 p.m. EDT. Meanwhile, the silver price continued to trade near 11-year highs, climbing 3.13 percent on the week to US$38.15 per ounce.

In base metals, copper ended the week were it started out, but was still trading near all time highs at US$5.60 per pound. The S&P GSCI (INDEXSP:SPGSCI) posted a 1.26 percent gain to finish the week at 551.61.

Top Canadian mining stocks this week

How did mining stocks perform against this backdrop?

Take a look at this week’s five best-performing Canadian mining stocks below.

Stock data for this article was retrieved at 4 p.m. EDT on Friday using TradingView’s stock screener. Only companies trading on the TSX, TSXV and CSE with market capitalizations greater than C$10 million are included. Mineral companies within the non-energy minerals, energy minerals, process industry and producer manufacturing sectors were considered.

1. Altima Energy (TSXV:ARH)

Weekly gain: 97.96 percent
Market cap: C$43.99 million
Share price: C$0.97

Altima Energy is a light oil and natural gas exploration and development company with operations in Alberta, Canada.

Its primary asset is the Richdale property in Central Alberta. The property consists of five producing light oil wells and sits on 5,920 acres of long-term reserves. The property hosts combined proved and probable reserves of just under 2 billion barrels of oil equivalent, with a pre-tax net present value of C$25.8 million.

The company also owns two wells at its Twinning light oil site near Nisku, seven producing wells at its Red Earth property in Northern Alberta and two multi-zone wells at its Chambers Ferrier liquid gas production property.

Shares in Altima started to gain after it released news on July 8 that it had completed a private placement for proceeds of up to C$5.5 million. Under the terms of the deal, the company will issue 20 million units at C$0.275 per unit, which each include one common share and one warrant allowing the holder to purchase a common share for C$0.40.

The company said that part of the proceeds would be used to complete field upgrades at its Red Earth and Richdale properties.

2. Kirkland Lake Discoveries (TSXV:KLDC)

Weekly gain: 81.82 percent
Market cap: C$11.26 million
Share price: C$0.10

Kirkland Lake Discoveries is a gold and copper exploration company focused on projects in its district-scale land package located in the Kirkland Lake area of Ontario, Canada.

Its holdings span an area of approximately 38,000 hectares in the Abitibi Greenstone Belt that has been host to past-producing gold and copper mines. It is broadly divided into KL West and KL East, which contain the Goodfish-Kirana and Lucky Strike gold projects, respectively, among others.

On April 29, the company announced it entered into a mining option agreement with Val-d’Or Mining (TSXV:VZZ) to acquire a 100 percent interest in the Winnie Lake and Amikougami properties, as well as mining claim purchase agreements with two vendors to acquire further claims around the Winnie Lake Pluton. The properties expand KL West’s southern portion.

Following the agreement, the company conducted grab samples at the Winnie Lake property and reported the results on July 9. One grab sample collected near the historic Winnie Shaft zone yielded grades of 1.6 grams per metric ton (g/t) gold, 28.2 g/t silver, 5.7 percent copper, 5.3 percent zinc and 1.65 g/t tellurium.

The company also discovered a quartz-veined intrusive outcrop 150 meters west of the shaft during field prospecting, with samples displaying characteristics of magmatic-hydrothermal copper-gold systems, including visible malachite and strong potassic alteration.

Additionally, Kirkland Lake reported it has received full drill permits for Winnie Lake and plans to initiate activities at the site this summer, focusing on the newly defined zones.

3. Happy Creek Minerals (TSXV:HPY)

Weekly gain: 70 percent
Market cap: C$10.33 million
Share price: C$0.085

Happy Creek Minerals is an exploration company focused on advancing a portfolio of assets in British Columbia, Canada.

Its primary focus has been on its Fox tungsten property located in the South Caribou region of the province. It comprises 135.9 square kilometers of mineral tenure and hosts deposits containing tungsten, molybdenum, zinc, indium, gold and silver. In total, 21,125 meters of exploration drilling have been carried out at the site, primarily in shallow holes, for resource definition.

Happy Creek’s share price began climbing Tuesday after the company announced a non-brokered private placement to raise gross proceeds of up to C$3.25 million in flow-through units at C$0.07 per share and non-flow-through units at C$0.05 per share.

The following day, Happy Creek upsized the offering to C$3.75 million.

The company plans to use the gross proceeds for drilling, exploration and development at Fox, as well as other exploration work in the Caribou.

4. Camino Minerals (TSXV:COR)

Weekly gain: 56.52 percent
Market cap: C$13.5 million
Share price: C$0.36

Camino Minerals is a copper exploration and development company with a portfolio of projects in Chile and Peru.

Earlier in 2025, the company shifted its focus to its newly acquired, construction-ready Puquois copper project in Chile.

In October 2024, Camino entered a definitive agreement to create a 50/50 joint venture with Nittetsu Mining (TSE:1515) that would acquire Cuprum Resources, which owns the Puquios project. The partners completed the acquisition April 17 and said they would turn their attention to project financing.

On March 17, Camino filed a prefeasibility study for the project. The study results demonstrate a post-tax net present value of US$118 million, with an internal rate of return of 23.4 percent and a payback period of 3.1 years at a fixed copper price of US$4.28. It also outlines all-in sustaining costs of US$2.00 per pound over a 14.2 year mine life.

In addition to the economic details, the included mineral resource estimate shows a measured and indicated resource of 149,000 metric tons of copper from 32.16 million metric tons of ore grading 0.46 percent copper.

Camino also owns the Los Chapitos project, which has been a long-time focus of the company. The project covers approximately 22,000 hectares near the coastal town of Chala, Peru, and hosts near-surface mineralization.

Camino has been conducting exploration efforts at Los Chapitos throughout the first half of 2025. On Wednesday, it reported trench results from the newly identified Mirador zone, including 1.07 percent copper over 90 meters, with a four-meter section containing 3.05 percent copper.

5. Solstice Gold (TSXV:SGC)

Weekly gain: 56.25 percent
Market cap: C$29.38 million
Share price: C$0.125

Solstice Gold is an exploration company focused on its flagship Strathy gold project in Ontario, which it acquired in June 2024.

The project consists of 45 claims covering an area of 45 square kilometers in the Temagami Greenstone belt. Historical documents report six gold showings in the central portion of the project areas, with documented mineralization at the Leckie prospect.

In its latest project update on July 2, Solstice announced it had wrapped up its spring drill program, which focused on four target areas. In total, the company completed 3,125 meters of drilling across 14 holes, and results are expected in July.

The company also reported that it had entered into an agreement to acquire 17 additional claims, which would increase the project area by 50 percent. It added that targets identified from its IP program may extend along strike into these claims.

FAQs for Canadian mining stocks

What is the difference between the TSX and TSXV?

The TSX, or Toronto Stock Exchange, is used by senior companies with larger market caps, and the TSXV, or TSX Venture Exchange, is used by smaller-cap companies. Companies listed on the TSXV can graduate to the senior exchange.

How many mining companies are listed on the TSX and TSXV?

As of February 2025, there were 1,572 companies listed on the TSXV, 905 of which were mining companies. Comparatively, the TSX was home to 1,859 companies, with 181 of those being mining companies.

Together the TSX and TSXV host around 40 percent of the world’s public mining companies.

How much does it cost to list on the TSXV?

There are a variety of different fees that companies must pay to list on the TSXV, and according to the exchange, they can vary based on the transaction’s nature and complexity. The listing fee alone will most likely cost between C$10,000 to C$70,000. Accounting and auditing fees could rack up between C$25,000 and C$100,000, while legal fees are expected to be over C$75,000 and an underwriters’ commission may hit up to 12 percent.

The exchange lists a handful of other fees and expenses companies can expect, including but not limited to security commission and transfer agency fees, investor relations costs and director and officer liability insurance.

These are all just for the initial listing, of course. There are ongoing expenses once companies are trading, such as sustaining fees and additional listing fees, plus the costs associated with filing regular reports.

How do you trade on the TSXV?

Investors can trade on the TSXV the way they would trade stocks on any exchange. This means they can use a stock broker or an individual investment account to buy and sell shares of TSXV-listed companies during the exchange’s trading hours.

Article by Dean Belder; FAQs by Lauren Kelly.

Securities Disclosure: I, Dean Belder, hold no direct investment interest in any company mentioned in this article.

Securities Disclosure: I, Lauren Kelly, hold no direct investment interest in any company mentioned in this article.

This post appeared first on investingnews.com

Abstract Chain:- Pudgy Penguins’ $PENGU token has soared this past week, climbing over 35%. This has been driven by Coinbase’s X avatar change and the SEC’s acknowledgment of a Canary Capital PENGU ETF filing. Beyond its market performance, the NFT brand is also making major business moves. Its consumer-focused Layer-2 network, Abstract Chain – the second

The post Abstrat Chain Seeking New Funding Round : Pudgy Penguins CEO Luca Netz appeared first on CoinGape.

As the crypto industry rejoices over the GENIUS Act’s passage, Coinbase Chief Legal Officer Paul Grewal shifts focus to a critical concern—state agencies’ refusal to acknowledge the CLARITY Act’s crypto staking guidance. Despite the CLARITY Act’s clear stance on staking-as-a-service as a non-security, several state agencies continue to pursue claims against crypto firms. This discrepancy

The post Coinbase CLO Slams State Agencies Over Crypto Staking Crackdown Despite CLARITY Act appeared first on CoinGape.

Analysts are once again predicting a new all-time high for the Pepe coin price amid Ethereum’s most recent surge. Pepe coin could soon emerge as this cycle’s breakout star thanks to growing whale activity and a growing holder base. PEPE Price Just a Step Away from New ATH In a recent video, popular analyst Jake

The post Analyst Predicts Pepe Coin Price As ETH Breaks $3,600- All Time High Soon? appeared first on CoinGape.

Polymarket data has now placed the odds of full XRP ETF approval at 86% following the successful debut of the ProShares Ultra XRP ETF. XRP ETF Approval Odds Jump to 86% According to Polymarket data, the odds of an approval of the XRP ETF have now surged past 86%. This marks a 15% increase in

The post XRP ETF Approval Odds Rise to 86% Following ProShares Launch Success appeared first on CoinGape.

BTC Vs. XRP: A former Ripple developer has shared an analysis suggesting that Strategy (formerly MicroStrategy), known for its Bitcoin-first investment approach, could have doubled its returns had it backed XRP instead of BTC. Ex-Ripple Developer Puts BTC vs XRP Strategy to the Test In a recent post on X, former Ripple developer Matt Hamilton

The post MicroStrategy Would Be Up 2x If It Backed XRP Over BTC, Reveals Ex-Ripple Dev appeared first on CoinGape.

The U.S. shipbuilding industry is looking for help. A South Korean company is answering the call.

Hanwha Philly Shipyard CEO David Kim, nodding to the gargantuan vessels under construction just off the Delaware River, on Wednesday offered the kind of vision that has brought some optimism back to the U.S. shipbuilding community.

“You take that level of experience, the technology that we have, the know-how, the process expertise, and so clearly, we believe we have a lot to bring to the Philly Shipyard, as well as to the U.S. maritime industrial base, in terms of modernization capacity,” he said on a walkthrough of the shipyard.

Hanwha Philly Shipyard CEO David Kim.Obtained by NBC News

Hanwha Group bought the Philly Shipyard in December for $100 million and plans to invest multiple times that amount in the yard, training over a thousand new workers and bringing in new high-tech equipment. The company hopes to build naval ships and become the first U.S. builder of specialized liquefied natural gas tankers.

Shipbuilding in the United States has been all but dormant. China, South Korea, Japan and Europe all produce far more ships than the United States, with the few shipyards still operating in the country concentrating on military ships.

Revitalizing shipbuilding has been one of the areas President Donald Trump has pointed to as part of a broader effort to bring manufacturing back to the United States — a move some see as shortsighted considering the costs associated with building the kind of gigantic modern ships that remain a core part of how goods and commodities move around the planet.

This post appeared first on NBC NEWS

One great habit to develop as an investor is regularly scanning the stock market. Whether you’re checking for stocks that are outperforming a benchmark, gapping up, reversing, or breaking out of a trading range, scanning keeps you in the loop and, importantly, helps you stay sharp and spot potential opportunities early on. 

During one of our routine scans, one stock stood out: Rigetti Computing, Inc. (RGTI), a company in a fast-moving quantum computing space. On Wednesday, RGTI closed the day up 30%, which turned some heads. What’s behind the move? Rigetti announced significant improvements in its platform, better performance metrics, and the 36-qubit system, a technical milestone in the quantum world.  

Should You Invest in RGTI?

If you ran any of the bullish predefined scans on StockCharts, you may have noticed RGTI popping up. That alone is a good reason to take a closer look at RGTI stock’s price action.

Looking at the daily chart of RGTI, the stock had a nice ride in late 2024. However, things cooled off in early January 2025 and, since then, the stock has been trading sideways until this week. On Wednesday, RGTI gapped up with strong volume, breaking out of that sideways range.

FIGURE 1. DAILY CHART OF RGTI STOCK. Since its rise in late 2024, the stock has been trading sideways until Wednesday, when it broke out of that range. Chart source: StockCharts.com. For educational purposes.

Back in June, RGTI bounced off its 50-day simple moving average (SMA), which is starting to slope upward—a healthy technical signal. With Wednesday’s price move, RGTI is above its May 27 and July 8 highs.

RGTI’s price isn’t too far from its all-time high, set in January. If the stock breaks above that level and has strong momentum, we could see it push to new highs. The Relative Strength Index (RSI) and Percentage Price Oscillator (PPO) are showing early signs of positive momentum.

On the other hand, if the stock pulls back and Wednesday’s gap up doesn’t get filled, RGTI could reverse either at the May 27 or July 8 high. A reversal with a rise in momentum would confirm an upside continuation. If RGTI falls below these levels, fills Wednesday’s gap up, and finds support at the 50-day SMA, it could go back to trading sideways, waiting for the next catalyst. A decline below the 50-day SMA would invalidate the uptrend.

A Rising Tide in Quantum Stocks?

Other stocks in the Quantum Computing space, like IonQ, Inc. (IONQ) and D-Wave Quantum, Inc. (QBTS), also saw gains on Wednesday.

Quantum computing stocks can be a bit of a roller coaster; they rallied at the end of 2024, dipped earlier this year, and are now gaining ground, thanks to encouraging news on quantum computing developments. The technology is in its early stages and could take years before it’s truly mainstream. So while these stocks are gaining attention now, the momentum may not be consistent.

If you’re a long-term investor with patience and curiosity, it may be worth adding RGTI, QBTS, ION, and others to your ChartLists. Track them regularly and watch for continued technical strength or signs of trend reversals. 


Disclaimer: This blog is for educational purposes only and should not be construed as financial advice. The ideas and strategies should never be used without first assessing your own personal and financial situation, or without consulting a financial professional.

There is no denying that the broad markets remain in a resilient uptrend off the April 2025 low.  But if there’s one thing I’ve learned from many years of analyzing charts, it’s to remain vigilant during bullish phases.  Even though I’ll assume the uptrend is still intact, that doesn’t mean I can stop looking for signs of potential weakness!

With that in mind, here are three bearish candle patterns that often pop up during bullish market phases.  By looking for these patterns in the stocks and ETFs that you own, you can hopefully get ahead of any corrective moves and take profits before it’s too late!

The Shooting Star Pattern

If you see a long upper shadow, little to no lower shadow, and the open and close are close together near the bottom of the day’s range, then you have identified a shooting star candle pattern.  If you’re familiar with the hammer candle pattern, then you can think of this as a hammer candle but basically everything is upside down!

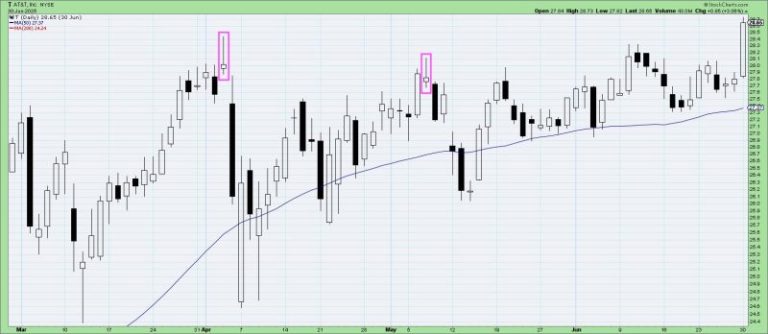
The chart of AT&T (T) has featured a number of shooting star candles so far in 2025.  Just before the selloff in early April, there was a clear shooting star candle after the March rally.  Then during the rally off the April low, a shooting star pattern in early May suggested that the uptrend phase was nearing an exhaustion point.

The Bearish Engulfing Pattern

One of the most recognizable patterns in the candlestick library, the bearish engulfing pattern represents a short-term rotation from accumulation to distribution.  Basically, a large up candle is followed by a large down candle, and the second day’s “real body” (the open-to-close range) engulfs the range of the first day’s real body.  

Look at the strength in the uptrend for Paramount Global (PARA) going into early June.  Then just before the 4th of July weekend, a bearish engulfing pattern suggests a change of character as the bears take control.  It’s worth noting that these candle patterns are not long-term signals, but rather indicate short-term dynamics.  So a bearish engulfing pattern suggests weakness for the next one to three bars.

The Evening Star Pattern

If you took the bearish engulfing pattern, and then added another small candle in the middle of those two days, then you’d have an evening star pattern.  Now most candlestick textbooks will tell you that the “star” day in the middle should include a gap, so there’s no overlap between that day’s range and the other two candles.  In practice, I’ve found most people ignore this detail and rather look for patterns with enough similarities to this basic structure.

Going back to the AT&T chart we used earlier, we can see an evening star pattern at the end of June.  A big day is followed soon after by a big down day, with a small candle in the middle.  This is a great example of where additional weakness led the price below the 50-day moving average, serving to confirm the bearish outlook as represented by the evening star pattern.

It’s so easy to become complacent during an extended bull market rally.  Investors that regularly scan for bearish candle patterns have an edge, as they can anticipate potential turning points before the uptrend changes in dramatic fashion to a new downtrend phase!

RR#6,

Dave

PS- Ready to upgrade your investment process?  Check out my free behavioral investing course!

David Keller, CMT

President and Chief Strategist

Sierra Alpha Research LLC

marketmisbehavior.com

https://www.youtube.com/c/MarketMisbehavior

Disclaimer: This blog is for educational purposes only and should not be construed as financial advice.  The ideas and strategies should never be used without first assessing your own personal and financial situation, or without consulting a financial professional.  

The author does not have a position in mentioned securities at the time of publication.    Any opinions expressed herein are solely those of the author and do not in any way represent the views or opinions of any other person or entity.