Archive

June 2025

Browsing

Apple Thursday made changes to its App Store European policies, saying it believes the new rules will help the company avoid a fine of 500 million euro ($585 million) from the EU for violating the Digital Markets Act.

The new policies are a complicated system of fees and programs for app makers, with some developers now paying three separate fees for one download. Apple also is going to introduce a new set of rules for all app developers in Europe, which includes a fee called the “core technology commission” of 5% on all digital purchases made outside the App Store.

The changes Apple announced are not a complete departure from the company’s previous policy that drew the European Commission’s attention in the first place.

Apple said it did not want to make the changes but was forced to by the European Commission’s regulations, which threatened fines of up to 50 million euros per day. Apple said it believed its plan is in compliance with the DMA and that it will avoid fines.

“The European Commission is requiring Apple to make a series of additional changes to the App Store,” an Apple spokesperson said in a statement. “We disagree with this outcome and plan to appeal.”

A spokesperson for the European Commission did not say that Apple was no longer subject to the fine. He said in a statement that the EC is looking at Apple’s new terms to see if the company is in compliance.

“As part of this assessment the Commission considers it particularly important to obtain the views of market operators and interested third parties before deciding on next steps,” the spokesperson said in a statement.

The saga in Brussels is the latest example of Apple fiercely defending its App Store policies, a key source of profit for the iPhone maker through fees of between 15% and 30% on downloads through its App Store.

It also shows that Apple is continuing to claim it is owed a commission when iPhone apps link to websites for digital purchases overseas despite a recent court ruling that barred the practice in the U.S.

Under the Digital Markets Act, Apple was required to allow app developers more choices for how they distribute and promote their apps. In particular, developers are no longer prohibited from telling their users about cheaper alternatives to Apple’s App Store, a practice called “steering” by regulators.

In early 2024, Apple announced its changes, including a 50 cent fee on off-platform app downloads.

Critics, including Sweden’s Spotify, pushed back on Apple’s proposed changes, saying that the tech firm chose an approach that violated the spirit of the rules, and that its fees and commissions challenge the viability of the alternative billing system. The European Commission investigated for a year, and it said on Thursday that it would again seek feedback from Apple’s critics.

“From the beginning, Apple has been clear that they didn’t like the idea of abiding by the DMA,” Spotify said last year.

Epic Games CEO Tim Sweeney, whose company successfully changed Apple’s steering rules in the U.S. earlier this year, accused Apple of “malicious compliance” in its approach to the DMA.

“Apple’s new Digital Markets Act malicious compliance scheme is blatantly unlawful in both Europe and the United States and makes a mockery of fair competition in digital markets,” Sweeney posted on social media on Thursday. “Apps with competing payments are not only taxed but commercially crippled in the App Store.”

The European Commission announced the 500 million euro fine in April. The commission at the time said that the tech company might still be able to make changes to avoid the fine.

Apple’s restrictions on steering in the United States were tossed earlier this year, following a court order in the long-running Epic Games case. A judge in California found that Apple had purposely misled the court about its steering concessions in the United States and instructed it to immediately stop asking charging a fee or commission on for external downloads.

The order is currently in effect in the United States as it is being appealed and has already shifted the economics of app development. As a result, companies like Amazon and Spotify in the U.S. can direct customers to their own websites and avoid Apple’s 15% to 30% commission.

In the U.S., Amazon’s iPhone Kindle app now shows an orange “Get Book” button that links to Amazon.com.

This post appeared first on NBC NEWS

It was a week of downward momentum for the gold price.

The yellow metal neared the US$3,400 per ounce level on Monday (June 23) as investors reacted to the weekend’s escalation in tensions in the Middle East, but sank to just above US$3,300 the next day.

The decline came as US President Donald Trump announced that Israel and Iran had agreed to a ceasefire. While the ceasefire has not gone entirely smoothly, with Trump expressing displeasure about violations, the news appeared to calm investors.

Gold’s safe-haven appeal took another hit toward the end of the week, when Trump said late on Thursday (June 26) that the US had signed a trade deal with China. Although details remain scarce — China’s commerce ministry confirmed the arrangement, but said little else — the gold price dropped on the news, closing Friday (June 27) at about US$3,274.

It was a different story for other precious metals this week.

Silver enjoyed an uptick, rising as high as US$36.79 per ounce before pulling back to the US$36 level. Whether it can continue breaking higher remains to be seen, but many experts are optimistic.

In fact, Randy Smallwood of Wheaton Precious Metals (TSX:WPM,NYSE:WPM) said that right now he’s perhaps more excited about silver than he is about gold. Here’s how he explained it:

There’s not a lot of new production coming on stream, just because most silver comes as a by-product from lead, zinc and copper mines — more than half of silver. And we’re just not seeing the investment into the base metals space that we need to sustain that production and grow that production.

As excited as I am about gold, I think silver’s got a few more fundamentals behind it that make it a pretty exciting time to be watching silver … silver’s got some catching up to do with respect to what gold’s done over the last few years.’

Watch the full interview with Smallwood for more on silver, as well as gold and platinum.

Speaking of platinum, it was also on the move this week, rising above US$1,400 per ounce.

The move has turned heads — despite a persistent supply deficit, platinum has spent years trading in a fairly tight range, and it hasn’t crossed US$1,400 since 2014.

Recent trends supporting platinum’s move include a shift toward platinum jewelry due to the high cost of gold, as well as larger platinum imports to the US earlier this year when tariff uncertainty was heating up. At the same time, miners have faced challenges.

‘This has led to tight forward market conditions,’ said Jonathan Butler of Mitsubishi (TSE:8058), ‘with a deep backwardation across the curve.’ In his view, these conditions will continue providing support for the precious metal in the coming weeks.

Bullet briefing — Gold repatriation, Rule Symposium

Germany, Italy to repatriate gold?

Germany and Italy are facing calls to bring home gold stored in the US.

According to the Financial Times, politicians and economists in the two countries are pushing for repatriation as a result of global geopolitical uncertainty, as well as concerns about Trump’s potential influence on the Federal Reserve as he continues to criticize Chair Jerome Powell.

‘We are very concerned about Trump tampering with the Federal Reserve Bank’s independence. Our recommendation is to bring the (German and Italian) gold home to ensure European central banks have unlimited control over it at any given point in time’ — Michael Jäger, Taxpayers Association of Europe

The news outlet calculates that German and Italian gold held in the US has a total value of about US$245 billion. Market participants agree that it would be a blow to relations with America if the countries were to bring their gold home at this time.

At least for now they seem unlikely to do so — although Italy’s central bank hasn’t commented, Germany’s Bundesbank said it sees the New York Fed as ‘trustworthy and reliable.’

Send your questions for the Rule Symposium

The Rule Symposium runs in Boca Raton, Florida, from July 7 to 11, and I’ll be heading there to interview Rick Rule, as well as Adrian Day, Lobo Tiggre, Andy Schectman, Dr. Nomi Prins and more.

Securities Disclosure: I, Charlotte McLeod, hold no direct investment interest in any company mentioned in this article.

This post appeared first on investingnews.com

US-based economist Peter Schiff has hit hard at US President Donald Trump for aggressively pursuing a Bitcoin strategy. While Trump is backing Bitcoin in a personal capacity and as president, Schiff theorizes that the US dollar will be the biggest casualty. Bitcoin Is Harmful To Our Country, Says Peter Schiff Barely a day after Donald

The post Peter Schiff Says Donald Trump’s Bitcoin Push Is Hurting The Dollar appeared first on CoinGape.

Cathie Wood, CEO of ARK Invest, has expressed confidence that a new directive from the U.S. Federal Housing Finance Agency (FHFA) could have a major impact on Bitcoin. The move, which aims to incorporate cryptocurrency holdings like Bitcoin into the mortgage qualification process, may help crypto holders access home loans without needing to convert their

The post Cathie Wood Predicts FHFA Mortgage Rule Could Boost Bitcoin “Significantly” appeared first on CoinGape.

XRP lawsuit update: The ongoing legal battle between Ripple Labs and the U.S. Securities and Exchange Commission (SEC) has led to widespread confusion about the scope of a recent injunction. Lawyer Fred Rispoli clarified that the injunction does not impact Ripple’s institutional sales moving forward. The explanation centers around the specific context of “institutional sales”

The post XRP Lawsuit: Lawyer Clarifies Why Injunction Won’t Affect Ripple’s Institutional Sales appeared first on CoinGape.

The Bitcoin (BTC) treasury market is heating up fast. Between June 23 and June 27, companies made 64 big announcements related to Bitcoin purchases and future plans. During this period, nine new treasury buyers stepped into the spotlight. New Institutions Add Nearly 6,000 BTC to Their Treasuries Together, these new players purchased a combined 5,898

The post New Bitcoin Treasuries Acquired 5,898 BTC This Week As Corporate Adoption Intensifies appeared first on CoinGape.

After 11 consecutive weeks of relentless Bitcoin buying, Strategy (formerly MicroStrategy) is bracing for another purchase announcement. Michael Saylor has dropped a clue for an incoming purchase that can send Strategy’s holdings above 600,000 BTC. Michael Saylor Flashes Buy Signal For Strategy Strategy founder Michael Saylor has shared the leading indicator for an incoming Bitcoin

The post Michael Saylor Signals New Bitcoin Acquisition For Strategy appeared first on CoinGape.

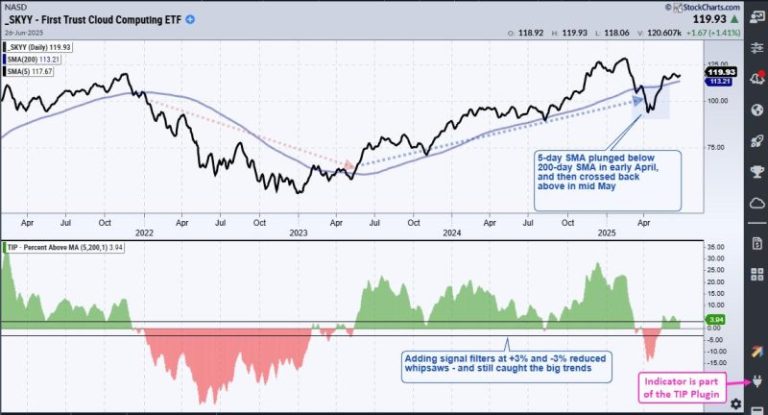
Chartists can improve their odds and increase the number of opportunities by trading short-term bullish setups within bigger uptrends. The first order of business is to identify the long-term trend using a trend-following indicator. Second, chartist can turn to more granular analysis to find short-term bullish setups. Today’s example will use the Cloud Computing ETF (SKYY).

***********************

, which has over a dozen reports. These cover the Zweig Breadth Thrust, trend-following signals, trailing stops and finding bullish setups. Check it out!

//////////////////////////////////////////////////

The bears are now left grasping at straws. What about tariffs? What about inflation? What about recession? What about the Fed? What about interest rates? What about the Middle East? What about the deficits? Blah, blah, blah.

When it comes to the media, you need to bury your head in the sand. Actually, take your head out of the sand and bury it in the charts. That’s where you’ll find the truth.

I said all-time highs were coming back at the April low and here we are. The S&P 500 has set a new all-time record high today and, barring a significant afternoon decline, will set its all-time closing high above the previous closing high of 6144, which was set on February 19, 2025. This new high comes just as we begin to prepare for Q2 earnings season. The run up to earnings season is generally and historically quite strong, so get ready for more highs ahead.

Since 1950, the S&P 500 has produced annualized returns of nearly 27% during the period June 28th through July 17th. This annualized pre-earnings run is nearly triple the average S&P 500 annual return of 9% since 1950. Care to guess how the NASDAQ and Russell 2000 have fared during this bullish pre-earnings period?

  • NASDAQ: +38.67%
  • Russell 2000 (IWM): +32.61% (bullish period ends July 15th for small caps)

Clearly, the bulls have the historical advantage for the next 3 weeks. Technically, evidence began turning in the bulls’ favor in mid-March, despite the last big move lower in early April. I have the research to back that up and will discuss it at an event on Saturday (more details below). While the stock market was rapidly declining in April, Wall Street was happily stealing everyone’s shares during the panicked selloff.

Technical Strength

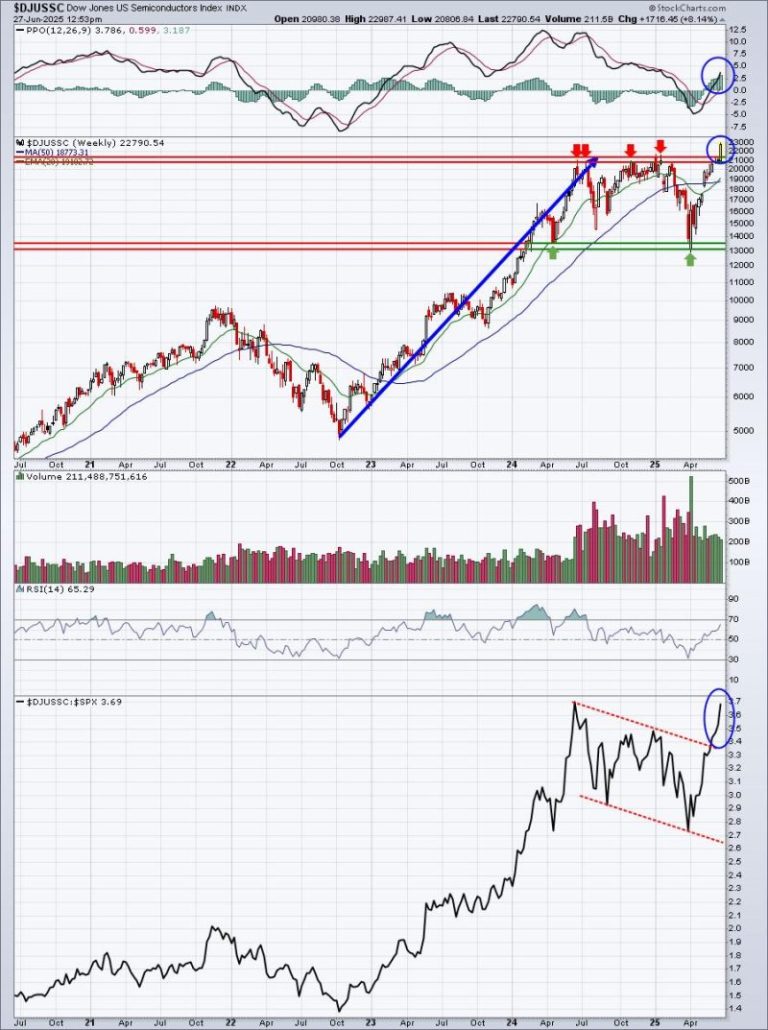
Two of the most important industry groups to follow are semiconductors ($DJUSSC) and software ($DJUSSW). These two groups are among the most influential in terms of driving the S&P 500 higher. Check out both of these charts and be sure to check out both the absolute and relative strength currently.

Semiconductors:

Software:

Now I’m going to provide charts of these same two groups, but this time show you how positively they correlate to the S&P 500’s direction over the course of this century.

Semiconductors:

Software:

Honestly, you don’t need a PhD in Economics to understand the above charts. It’s really quite simple. When semiconductors and software are rallying to new highs and showing relative strength, BUY U.S. stocks! They both have extremely tight positive correlation with the S&P 500 and they both look very technically sound right now.

Interest Rate Cut

It’s coming and it’s coming fast! I’m now convinced that the Fed will cut the fed funds rate in a month at their next scheduled meeting on July 29-30. I’m not saying it because I feel the Fed should cut or needs to cut. I’m saying it because there’s a ton of buying right now in the 1-month treasury, sending its yield down. The 1-month treasury yield ($UST1M) typically begins to move BEFORE any Fed action occurs. We saw it back in August/September 2024, just prior to the 50 basis point cut at the September 2024 meeting:

The black directional lines in the bottom panel mark approximately the date that the Fed lowered the fed funds rate. The red directional lines in the top panel highlight the downward movement in the $UST1M PRIOR to the Fed’s lowering roughly a month later. Again, I’m not making this stuff up. The charts are telling me a story here and the current story is that rates are about to come down.

Checkmate bears.

Follow the charts, not the media!

The Game

I’m beginning to believe that capitulation is nothing more than a staged event for the Wall Street elite and we’re the panicked pawns running around with our hair on fire. Those days are over for EarningsBeats.com members. We saw this one coming, just like we saw it coming in 2022. Getting out at the top with the Wall Street elite and getting back in at the bottom before them is an excellent recipe for beating the S&P 500 by a mile!

Learning is the key. We focus on market research, guidance, and education at EarningsBeats.com. Those are our 3 pillars of business. Calling the 2025 market top wasn’t a coincidence. We’ve done it before and we’ll do it again. Jumping back in near the bottom was no coincidence either. Our signals are proven and they work.

On Saturday morning at 10:00am ET, we’re hosting a FREE educational event, “Trading the Truth: How Market Manipulation Creates Opportunity”. I’m going to show everyone the “play-by-play” of how we were able to move to cash BEFORE the market top and back into stocks NEAR the market bottom. Market tops form with many of the same signals each time. To learn more about this event and to register with your name and email address, CLICK HERE.

If you’ve struggled with all the uncertainty in 2025 and haven’t trusted stocks, it’s time that you change your process and strategies. I’ll see you on Saturday!

Happy trading!

Tom

If you’ve looked at enough charts over time, you start to recognize classic patterns that often appear. From head-and-shoulders tops to cup-and-handle patterns, they almost jump off the page when you bring up the chart. I would definitely include Fibonacci Retracements on that list, because before I ever bring up the Fibonacci tool on StockCharts, I’m pretty confident the levels are going to line up well with the price action.

Today, we’re going to look at a breakout name that shows why Fibonacci Retracements can be so valuable for confirming upside potential. We’ll also explain some best practices for identifying the most important price levels to use when setting up a Fibonacci framework. Finally, we’ll show how Fibonacci analysis could have helped you validate the current uptrend phase for the S&P 500 index.

Confirming Breakouts: Norwegian Cruise Line Holdings (NCLH)

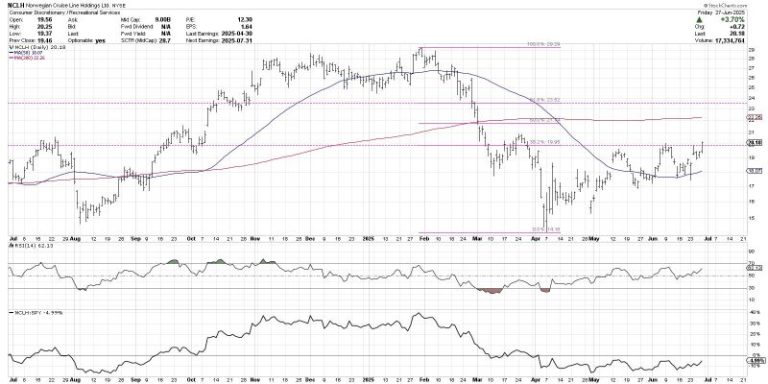
I started dropping quite a few Fibonacci Retracements on price charts soon after the April 7, 2025 market low. As stocks experienced a sudden and severe bounce off those lows, it became clear that we would need some way to validate a potential upside swing. That helped me zero in on the $20 level for Norwegian (NCLH), a level which was finally eclipsed this week.

Using the January high and the April low, we can see a 38.2% Fibonacci level come in right around $20. A gap higher in mid-May took NCLH close to that level, which was then retested again in early June. After bouncing off the 50-day moving average last week, Norwegian finally pushed above this first Fibonacci resistance level with Friday’s rally.

One of the ways we can differentiate between a “dead cat bounce” off a major low and the beginning of a much larger recovery phase is to key in on the first Fibonacci retracement level. If the price can push above this initial upside target, ideally on heavier than normal volume, then the chances of further upside are significantly increased.

In the case of NCLH, we can now bump up a price target to further Fibonacci levels. The 50% line, just below $20, lines up fairly well with the 200-day moving average. The 61.8% comes in right around $23.50, which represents my next upside target, assuming this week’s strength is confirmed by a follow-through day next week.

Identifying Pullbacks: Raytheon Technologies (RTX)

We can also use Fibonacci Retracements to identify downside targets after a major price peak. In the case of Raytheon Technologies (RTX), that means we use the April low and the high from mid-June to generate potential support levels.

In this case, we can see that the Fibonacci retracement levels line up very well with traditional support levels using the price action itself. The 38.2% level lines up with the mid-June low around $135, which also coordinates with the 50-day moving average. Beyond that support, the 50% level sits right at the late May low at $131, and the 61.8% level comes in right around the early May support at $126.

Given an initial pullback from the June peak around $149, I’m seeing strong potential support at the 38.2% level and 50-day moving average around $135. Now I can use Fibonacci levels to better define my risk vs. reward, showing how much downside action I’d anticipate while still keeping an eye on a return to the previous all-time highs.

Validating Uptrends: The S&P 500 Index ($SPX)

Sometimes Fibonacci Retracements are valuable in that they help validate that an uptrend is progressing with a decent pace. For the S&P 500 chart, every break of a Fibonacci resistance level has confirmed the strength of the broad market indexes off the April low.

It took only two sessions for the SPX to break above the 38.2% retracement of the February to April downtrend phase. In fact, the S&P almost reached the 50% level before pulling back to around 5100 in mid-April. From there, we can see a gap back above the 38.2% level, which helped confirm the strength of the new uptrend phase.

I still have the pink trendline on my chart that I remember drawing during the downtrend phase. “As long as the S&P remains below trendline resistance, the market is in a clear downtrend,” I remember saying out loud on my market recap show. So when the SPX broke above the 50% level, as well as that clear trendline, I was forced to acknowledge the staying power of this new uptrend phase.

The S&P 500 stalled out at the 61.8% retracement level in early May, but another price gap higher signaled that the final Fibonacci resistance level was no longer going to hold. And once you eclipse the final Fibonacci level, that implies a full retest back to the 100% point.

So am I surprised that the S&P 500 has pushed to new all-time highs this week? Absolutely not. Indeed, using Fibonacci Retracements on charts like this have helped me admit when a new uptrend is showing strength, and provide plenty of reminders to follow the trend until proven otherwise!

RR#6,

Dave

P.S. Ready to upgrade your investment process? Check out my free behavioral investing course!


David Keller, CMT

President and Chief Strategist

Sierra Alpha Research LLC

marketmisbehavior.com

https://www.youtube.com/c/MarketMisbehavior


Disclaimer: This blog is for educational purposes only and should not be construed as financial advice. The ideas and strategies should never be used without first assessing your own personal and financial situation, or without consulting a financial professional.

The author does not have a position in mentioned securities at the time of publication. Any opinions expressed herein are solely those of the author and do not in any way represent the views or opinions of any other person or entity.