Archive

May 30, 2025

Browsing

SIL Silver Miners

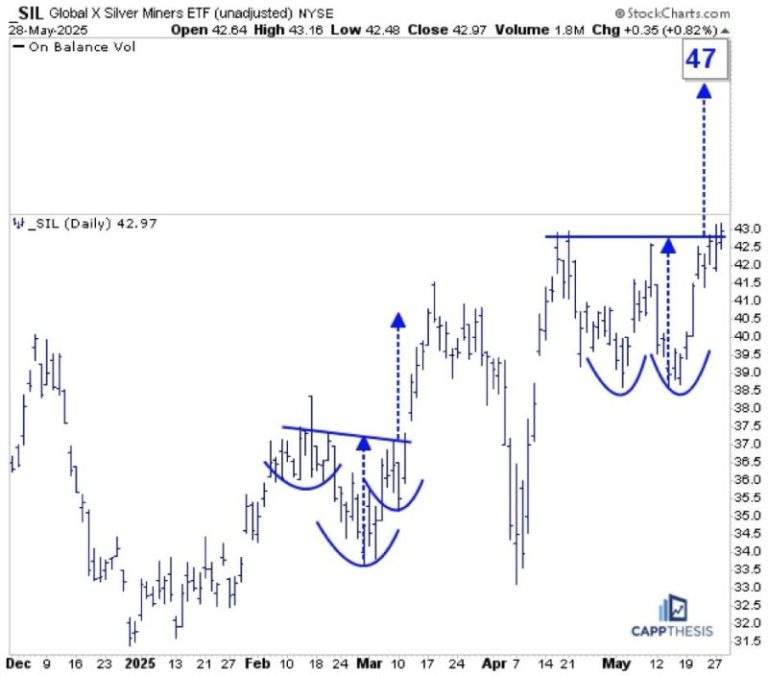
SIL was among the leaders yesterday and now is close to triggering this double-bottom bullish pattern. Staying above the 43-mark would target 47. That’s not a big move, but let’s remember that SIL is sporting bullish formations on its longer-term charts, too.

FIGURE 1. DAILY CHART OF GLOBAL X SILVER MINERS ETF (SIL).

SIL – Weekly

Firstly, the double-bottom pattern on this weekly log chart annotated in blue remains alive. This objective is up near 49.

Secondly, the area highlighted in green here is the same pattern pictured on the daily chart above. That area is sitting at the very top of a much bigger bullish inverse head-and-shoulders pattern that extends all the way back to 2021. Thus, if the short-term breakout works, it will trigger this one, as well. That target is in the mid-70s…

FIGURE 2. WEEKLY CHART OF GLOBAL X SILVER MINERS ETF (SIL).

SIL – Monthly

And that green pattern above is part of this MUCH larger, 13-year potential double bottom. We still have a while to go before this one is triggered, but it’s important to keep all of these in the back of our minds.

Anyone who trades or tracks SIL knows that short-term whipsaws are the norm. So, while these breakouts may not be clean, the bullish structures are clear. The bottom line is that if SIL continues to make higher highs and higher lows, the patterns will continue to work.

FIGURE 3. MONTHLY CHART OF GLOBAL X SILVER MINERS ETF (SIL).

USO Crude Oil

USO was among the leaders yesterday, but it’s still trying to bust through its 50-DMA, which has been the sticking point the last few weeks. If it can soon, USO could complete this potential bullish inverse H&S pattern. The upside target would be in the 77-78 range, and that would align with key short-term tops from the last year. First step, push above the 50-day line…

FIGURE 4. DAILY CHART OF US OIL FUND (USO).

NVDA

The obvious question every time NVDA rallies is whether it’s too late to buy.  To get a true sense of the stock’s technical prospects, we need to view it across different charts and time frames.

First, here’s a view of the bullish flag pattern we cited on Tuesday (along with TSLA, GOOGL and META). Given the preceding staircase-like advance, the starting point of the flagpole is subjective. We’re using the early May low given that the stock avoided filling a gap from a few days earlier.

Regardless, the measured move counts to the 161 zone, which would be a new all-time high.

FIGURE 5. DAILY CHART OF NVIDIA CORP. (NVDA).

This second one is a daily chart that extends all the way back to 2010 and shows times when breaking below or above the 200-DMA led to strong, extended moves for the stock. From this angle, the recent 200-day breach didn’t last that long at all, and now NVDA has the chance to once again follow through after breaking back above it over the last few weeks.

FIGURE 6. LONGER-TERM DAILY CHART OF NVIDIA CORP. (NVDA).

Here’s a weekly, log chart going back to the 2022 low. NVDA has leveraged three major pattern breakouts since then to power the astounding rally the last two-plus years. With the stock last having made a new high last October and being net flat since last July, an eventual push back above the 150-zone could prompt big pattern-breakout number four.

FIGURE 7. WEEKLY CHART OF NVIDIA CORP. (NVDA).

Lastly, here are the biggest breakouts on this monthly chart that goes back over two decades. Again, looking at it from this viewpoint makes the last 11 months appear like a very small digestive phase, especially compared to the other three on the chart. Thus, the first step will be seeing how well NVDA can hold the opening gap. That’s important for today, but much more important for the days and weeks to come.

FIGURE 8. MONTHLY CHART OF NVIDIA CORP. (NVDA).

Nuclear energy stocks are on a tear, and Oklo Inc. (OKLO), Cameco Corp. (CCJ), and NuScale Power Corporation (SMR) are leading the charge, fueled by presidential executive orders, investor hype, and hopes for a nuclear-powered future.

Is It Time to Go Nuclear?

These names bucked the trend on Wednesday, rising even as the major U.S. indexes fell. I found all three while running a P&F Double Top Breakout scan, with SMR also appearing in the New 52-Week Highs scan. But are these gains a sign of genuine investment opportunities, or is this high-risk subsector just radioactive for your portfolio? To analyze this, let’s break down their profiles and charts to see whether the “glow” here points to real promise—or simply masks a toxic risk.

Here’s a PerfCharts snapshot of all three stocks against the SPDR S&P 500 ETF (SPY), our broader market proxy.

FIGURE 1. PERFCHARTS OF SMR, OKLO, CCJ, AND SPY.

While CCJ steadily lagged behind the S&P 500 until this month, both OKLO and SMR began outperforming the broader market starting in mid-October of last year. Their relative performance to date is so strong that it appears almost unsustainable in the short term.

All three mid-cap stocks are also showing robust StockCharts Technical Rank (SCTR) scores—OKLO at 99.6, SMR at 99.3, and CCJ at 89.9 at the time of writing. While this can indicate technical strength, it can also signal irrational exuberance among retail investors.

Robust SCTR Scores but Divergent Fundamentals

Another thing to note is the notable difference in their fundamentals. SMR and OKLO have negative P/E ratios, suggesting that their surges are driven more by promise and speculation than by profits. CCJ, with a P/E ratio of 149, is raking in some profits, but may also be riding an overcrowded wave of hype.

Ultimately, while technical performance can sometimes lead to fundamental strength—or mask fundamental weakness—it’s worth taking a closer look at these leading names in the nuclear subsector to understand the opportunities and risks they present. Let’s break it down further by examining each stock’s technical picture and what it suggests about investor conviction.

OKLO: Testing Highs, Buying the Dip?

To start, here’s a daily chart of nuclear energy startup OKLO.

FIGURE 2. DAILY CHART OF OKLO. In contrast to the other two nuclear stocks, OKLO is potentially experiencing higher levels of accumulation.

OKLO recently tested its all-time high of $59 before pulling back. The Relative Strength Index (RSI) shows the stock was deep within overbought territory, hinting at caution. Still, what’s interesting is that OKLO’s Accumulation/Distribution Line (ADL), plotted behind the price, remains strong. This suggests that even as the price retreats, buying pressure may still be present—hinting that investors might be looking to buy the dip rather than “sell the news.”

The key thing to watch now is how deep this retracement goes. If investors are still optimistic about OKLO’s fundamental outlook, you might see a bounce within the first two quadrants marked by the Quadrant Lines on the chart. Pay particular attention to the critical support range around the center line at $38, shown in the yellow-shaded area. If the price falls below this level, it could be a sign of weakness, suggesting the stock is more of a FOMO-driven trade than one backed by long-term conviction.

SMR: Hype or Healthy Pullback?

Next, we’ll shift over to a daily chart of SMR. Among the three, SMR is the only to notch a new all-time high. But does this signal the beginning of a new leg up, or the end of a surge that lacks substance?

FIGURE 3. DAILY CHART OF SMR. What happens next will show whether investors truly believe in the stock—or if the rally was driven by short-term hype.

SMR immediately declined after making a parabolic move to a new all-time high. As the RSI confirms, the stock was well-overbought. Now, it’s a matter of measuring the depth of the pullback.

I plotted a Fibonacci Retracement to highlight potential support levels. There are several zones of support from previous swing highs and a concentrated trading area between the 61.8% and 38.2% retracement levels. If investor confidence stays strong, expect a possible bounce between $21 and $24, marking the 61.8% and 50% Fib levels respectively. A deeper drop below the 61.8% level might still find support around $15, but that would also suggest that the rally was driven more by sentiment than strategic conviction.

CCJ: Underperforming Stock, Profitable Company

Lastly, let’s take a look at the most earnings-positive company among the three. Here’s a daily chart of CCJ.

FIGURE 4. DAILY CHART OF CCJ. The critical level to watch is the range between $50 – $52.

CCJ has a similar technical profile to OKLO and SMR—it’s overbought, and it tested its all-time high on a parabolic surge, leading to a pullback.

However, instead of measuring the various degrees of its potential retracements (using Fib or Quadrants), I’m focusing on the key range of $50–$52. Why? Because, in addition to marking a broad level that has acted as both support and resistance since October of last year, this range also shows a high concentration of trading activity, as indicated by the Volume-by-Price indicator.

If longer-term conviction holds, CCJ should bounce at this level. If not, expect the stock to decline further—although it may eventually find support at lower levels, it likely wouldn’t be worth chasing at that point.

At the Close

Nuclear energy stocks like OKLO, SMR, and CCJ have captured market attention, defying broader trends and flashing bullish technical patterns. But while momentum and investor enthusiasm are driving these moves, each stock also faces questions about sustainability and fundamentals.

Are we looking at a healthy dip—or is Wall Street just selling the news? To answer that question, keep an eye on the key technical levels outlined above. With these standout names in an emerging (and therefore highly uncertain) subsector, the technicals will likely reveal whether the market’s leaning toward conviction or just chasing the hype.


Disclaimer: This blog is for educational purposes only and should not be construed as financial advice. The ideas and strategies should never be used without first assessing your personal and financial situation, or without consulting a financial professional.

Uranium prices are on the rise after President Donald Trump signed a series of executive orders aimed at revitalizing the US nuclear industry — including measures to strengthen the domestic fuel supply and expand the nuclear workforce.

On Tuesday (May 27), the U3O8 spot price climbed to US$72 per pound, its first move above the US$70 mark since early February.

The positivity and Trump’s promise to fast track mine permits has also benefited uranium companies with projects in the US.

One of those companies is Anfield Energy (TSXV:AEC,OTCQB:ANLDF), which reported receiving federal approval from the US Department of the Interior for its Velvet-Wood uranium and vanadium project in Utah on Tuesday. The approval marks the first uranium mine greenlit under Trump’s emergency declaration to revive the domestic nuclear fuel cycle.

According to the statement, the Bureau of Land Management completed the environmental review in just 14 days, a timeline officials say reflects a broader shift toward prioritizing critical mineral projects.

“This approval marks a turning point in how we secure America’s mineral future,” said Secretary of the Interior Doug Burgum. “We’re reducing dependence on foreign adversaries and ensuring our military, medical and energy sectors have the resources they need to thrive.”

Shares of Anfield surged to a year-to-date high of C$0.115 following the news, and have since settled in the C$0.10 range.

Rising tide raises all ships

Although the US president’s latest round of executive orders have catalyzed prices in recent days, the uranium sector’s long term fundamentals have also offered support.

The growing demand from artificial intelligence data centers, paired with a push for carbon free energy sources makes a strong case for the expansion of nuclear energy capacity. As such, the current developments have added tailwinds to several uranium and nuclear sector players up and down the supply chain.

Over the past five trading days, enCore Energy (TSXV:EU,NASDAQ:EU) shares have risen 33.33 percent, from C$2.18 on May 22 to C$2.92 on Wednesday (May 28). The company holds a portfolio of various stage uranium projects located in Texas, Colorado, Wyoming and South Dakota. Currently, the Alta Mesa and Rosita projects in Texas are operational.

Uranium Energy (NYSEAMERICAN:UEC) has also seen its share price increase, adding 31 percent over the same five day period, to trade for US$2.89. Boasting a portfolio of 10 US uranium assets in various stages of development from exploration to near term production, the company also owns and operates the Hobson ISR processing plant in Texas, which is operational.

Ur-Energy (TSX:URE,NYSEAMERICAN:URG), which owns the producing Lost Creek mine and the construction-stage Shirley Basin project in Wyoming, is another company experiencing heightened investor interest this past week.

Shares of Ur-Energy rose 26.53 percent over the five day session, and are currently valued at C$1.24.

Diversified players like Western Uranium and Vanadium (CSE:WUC,OTCQX:WSTRF) were also buy targets following the president’s energy directive. The company, which is focused on advancing its past-producing Sunday mine complex in Colorado, saw its shares increase 28 percent since May 21, trading for C$1.14.

ASX-listed companies were also garnering attention, Boss Energy (ASX:BOE,OTCQX:BQSSF) in particular, which holds a 30 percent stake in the producing Alta Messa uranium mine. The joint venture partner for enCore saw its share price value grow 14.27 percent in the last five days, to AU$4.13.

While these companies were first to see Trump’s executive orders boost their share prices, there are many other US-focused uranium companies with projects all over the country now awaiting pro-nuclear upticks.

All share price information was obtained from TradingView on May 28, 2025. Data on project status was retrieved from Mining Data Online.

Securities Disclosure: I, Georgia Williams, hold no direct investment interest in any company mentioned in this article.

This post appeared first on investingnews.com

Group Eleven Resources Corp. (TSXV: ZNG) (OTCQB: GRLVF) (FSE: 3GE) (‘Group Eleven’ or the ‘Company’) is pleased to announce the appointment of Jasmine Lau, CPA, as Chief Financial Officer (‘CFO’) of Group Eleven, replacing Jeannine Webb, effective May 30, 2025.

Jasmine is a Vancouver-based Chartered Professional Accountant with over 16 years’ experience in the resource sector, having served as the Chief Financial Officer for several mineral exploration companies. She is currently the CFO of Minaurum Gold Inc, Forte Minerals Corp., and Cascadia Minerals Ltd. Prior to that, Jasmine also served as CFO to a various number of other private and public mineral exploration companies.

‘On behalf of Group Eleven and its Board of Directors, I am very pleased to welcome Jasmine to the team,’ stated Bart Jaworski, CEO. ‘Jasmine’s appointment brings a wealth of relevant experience and skills to the Company. I would also like to sincerely thank Jeannine Webb for her valuable contributions and dedication to the Company over the past three years.’

About Group Eleven Resources

Group Eleven Resources Corp. (TSXV: ZNG) (OTCQB: GRLVF) (FSE: 3GE) is a mineral exploration company focused on advanced stage zinc exploration in Ireland. Additional information about the Company is available at www.groupelevenresources.com.

ON BEHALF OF THE BOARD OF DIRECTORS
Bart Jaworski, P.Geo.
Chief Executive Officer

E: b.jaworski@groupelevenresources.com | T: +353-85-833-2463

Neither TSX Venture Exchange nor its Regulation Services Provider (as that term is defined in the policies of the TSX Venture Exchange) accepts responsibility for the adequacy or accuracy of this release.

Cautionary Note Regarding Forward-Looking Information

This press release contains forward-looking statements within the meaning of applicable securities legislation. Such statements include, without limitation, statements regarding the future results of operations, performance and achievements of the Company, including the timing, content, cost and results of proposed work programs, the discovery and delineation of mineral deposits/resources/ reserves and geological interpretations. Although the Company believes that such statements are reasonable, it can give no assurance that such expectations will prove to be correct. Forward-looking statements are typically identified by words such as: believe, expect, anticipate, intend, estimate, postulate and similar expressions, or are those, which, by their nature, refer to future events. The Company cautions investors that any forward-looking statements by the Company are not guarantees of future results or performance, and that actual results may differ materially from those in forward-looking statements as a result of various factors, including, but not limited to, variations in the nature, quality and quantity of any mineral deposits that may be located. All of the Company’s public disclosure filings may be accessed via www.sedar.com and readers are urged to review these materials, including the technical reports filed with respect to the Company’s mineral properties.

To view the source version of this press release, please visit https://www.newsfilecorp.com/release/253899

News Provided by Newsfile via QuoteMedia

This post appeared first on investingnews.com

(TheNewswire)

Brossard (Québec) TheNewswire – le 30 mai 2025 – CORPORATION CHARBONE HYDROGÈNE (TSXV: CH OTCQB: CHHYF, FSE: K47 ) (« Charbone » ou la « Société »), la seule compagnie d’Amérique du Nord cotée en bourse axée sur la production et la distribution d’hydrogène vert, annonce aujourd’hui ses résultats financiers et opérationnels pour la période de trois mois se terminant le 31 mars 2025.

Tous les permis nécessaires à la construction de l’usine de Sorel-Tracy ont été obtenus et Hydro-Québec, le distributeur d’énergie provincial, travail à compléter l’interconnexion, ce qui permettra au projet de respecter l’échéancier de production de 2025.

FAITS SAILLANTS T1 2025:

  • Les flux de trésorerie négatifs liés aux activités d’exploitation ont diminué de 7 % pour atteindre 620 097 $ au premier trimestre de 2025, contre 663 843 $ au premier trimestre de 2024 (activités toujours en resserrement des frais généraux et administratifs).

  • Les revenus ont diminué à 5 067 $ au premier trimestre de 2025, contre 81 637$ au premier trimestre de 2024 (générés par l’acquisition de Wolf River le 1 er décembre 2022). Il y a une réduction temporaire des services à la centrale à la suite d’une panne d’équipement, qui sera réparée avec une capacité accrue.

  • La Société a clôturé des actions pour le règlement de dettes au management de 310 000 $ et des exercices de bons de souscription totalisant 293 270 $ (10 000 $ en T1 2024).

  • La Société a annoncé la signature d’une convention de financement pour une facilité de capital de construction pouvant atteindre 50 millions de dollars américains ; et

  • La Société a annoncé avoir signé une entente d’approvisionnement avec un producteur américain de gaz industriels de premier plan afin d’élargir son offre aux clients et de générer des revenus immédiats à partir d’une source diversifiée.

La gestion financière rigoureuse de Charbone et ses nouveaux partenariats stratégiques lui permettent de concrétiser sa vision : devenir un leader nord-américain des réseaux de distribution d’hydrogène vert et de gaz industriels. Ces avancées soulignent sa volonté de jouer un rôle moteur dans la transition énergétique.

La direction est motivée à poursuivre ses efforts pour faire avancer et achever le(s) projet(s) annoncé(s) avec une structure administrative allégée , a déclaré Benoit Veilleux, Chef de la direction financière et secrétaire corporatif de Charbone. Avec la signature d’une entente de principe sur le financement du capital de construction et sujet à l’achèvement du développement des projets, Charbone dispose désormais d’un partenaire pour déployer et livrer son/ses projet(s) actuel(s) et d’un potentiel de croissance à court terme.


Click Image To View Full Size


Click Image To View Full Size

À propos de Charbone Hydrogène Corporation

Charbone est une entreprise intégrée d’hydrogène vert disposant de capacités stratégiques de distribution de gaz industriels en Amérique du Nord. Tout en poursuivant le développement de son réseau modulaire de production d’hydrogène vert, Charbone s’appuie également sur des partenariats commerciaux pour fournir de l’hydrogène, de l’hélium et d’autres gaz industriels sans les exigences en capital élevées des usines de production. Cette approche améliore les sources de revenus, réduit les risques opérationnels et accroît la flexibilité sur le marché. Charbone reste la seule société purement axée sur l’hydrogène vert cotée en bourse en Amérique du Nord, avec des actions cotées à la Bourse de croissance TSX (TSXV: CH); sur les marchés OTC (OTCQB: CHHYF); et à la Bourse de Francfort (FSE: K47). Pour plus d’informations, visiter www.charbone.com .

Énoncés prospectifs

Le présent communiqué de presse contient des énoncés qui constituent de « l’information prospective » au sens des lois canadiennes sur les valeurs mobilières (« déclarations prospectives »). Ces déclarations prospectives sont souvent identifiées par des mots tels que « a l’intention », « anticipe », « s’attend à », « croit », « planifie », « probable », ou des mots similaires. Les déclarations prospectives reflètent les attentes, estimations ou projections respectives de la direction de Charbone concernant les résultats ou événements futurs, sur la base des opinions, hypothèses et estimations considérées comme raisonnables par la direction à la date à laquelle les déclarations sont faites. Bien que Charbone estime que les attentes exprimées dans les déclarations prospectives sont raisonnables, les déclarations prospectives comportent des risques et des incertitudes, et il ne faut pas se fier indûment aux déclarations prospectives, car des facteurs inconnus ou imprévisibles pourraient faire en sorte que les résultats réels soient sensiblement différents de ceux exprimés dans les déclarations prospectives. Des risques et des incertitudes liés aux activités de Charbone peuvent avoir une incidence sur les déclarations prospectives. Ces risques, incertitudes et hypothèses comprennent, sans s’y limiter, ceux décrits à la rubrique « Facteurs de risque » dans la déclaration de changement à l’inscription de la Société datée du 31 mars 2022, qui peut être consultée sur SEDAR à l’adresse www.sedar.com; ils pourraient faire en sorte que les événements ou les résultats réels diffèrent sensiblement de ceux prévus dans les déclarations prospectives.

Sauf si les lois sur les valeurs mobilières applicables l’exigent, Charbone ne s’engage pas à mettre à jour ni à réviser les déclarations prospectives.

Ni la Bourse de croissance TSX ni son fournisseur de services de réglementation (tel que ce terme est défini dans les politiques de la Bourse de croissance TSX) n’acceptent de responsabilité quant à la pertinence ou à l’exactitude du présent communiqué.

Pour contacter Corporation Charbone Hydrogène :

Téléphone bureau: +1 450 678 7171

Courriel: ir@charbone.com

Benoit Veilleux

Chef de la direction financière et secrétaire corporatif

Copyright (c) 2025 TheNewswire – All rights reserved.

News Provided by TheNewsWire via QuoteMedia

This post appeared first on investingnews.com

(TheNewswire)

Brossard, Quebec TheNewswire – May 30, 2025 Charbone Hydrogen Corporation (TSXV: CH; OTCQB: CHHYF; FSE: K47) (the ‘Company’ or ‘CHARBONE’), North America’s sole publicly traded pure-play company focused on green hydrogen production and distribution, today announces its financial and operational results for the three-month period ending March 31, 2025.

All necessary permits for the construction of the Sorel-Tracy facility have been secured, and Hydro-Québec, the provincial energy distributor, is working towards completing the interconnection, keeping the project on schedule for 2025 production.

Q1 2025 HIGHLIGHTS:

  • Negative cash flows from operating activities decreased by 7% to $620,097 in Q1 2025, down from $663,843 in Q1 2024 (activities still tightening general and administrative expenses).

  • Revenue decreased to $5,067 in Q1 2025, down from $81,637 in Q1 2024 (generated from the Wolf River acquisition on December 1, 2022). There is a temporary reduction in services at the dam following an equipment failure, which will be repaired with increased capacity.

  • The Company has closed shares for the management debt settlement of $310,000 and exercises of warrants totaling $293,270 ($10,000 in Q1 2024).

  • The Company announced the signing of a term sheet for a construction capital facility of up to US $50 million; and

Charbone’s disciplined financial management and new strategic partnerships position the company to achieve its vision of becoming a North American leader in green hydrogen and industrial gases distribution networks. These advancements underscore its commitment to being a game-changer in the energy transition.

Management is motivated to continue its efforts to advance and complete the announced project(s) with a lean administrative structure,’ said Benoit Veilleux, Chief Financial Officer and Corporate Secretary of CHARBONE . ‘With the construction capital facility term sheet in place and subject to completing project development activities, CHARBONE now has a partner to deploy and deliver its current project(s) and a growth potential in the short term.


Click Image To View Full Size


Click Image To View Full Size

About Charbone Hydrogen Corporation

CHARBONE is an integrated green hydrogen company with strategic distribution capabilities of industrial gases across North America. While continuing to develop its modular green hydrogen production network, CHARBONE also leverages commercial partnerships to supply hydrogen, helium, and other industrial gases without the capital-intensive requirements of production facilities. This approach enhances revenue streams, reduces operational risks, and increases market flexibility. CHARBONE remains North America’s only publicly traded pure-play green hydrogen company, with shares listed on the TSX Venture Exchange (TSXV: CH), the OTC Markets (OTCQB: CHHYF), and the Frankfurt Stock Exchange (FSE: K47). For more information, visit www.charbone.com .

Forward-Looking Statements

This news release contains statements that are ‘forward-looking information’ as defined under Canadian securities laws (‘forward-looking statements’). These forward-looking statements are often identified by words such as ‘intends’, ‘anticipates’, ‘expects’, ‘believes’, ‘plans’, ‘likely’, or similar words. The forward-looking statements reflect management’s expectations, estimates, or projections concerning future results or events, based on the opinions, assumptions and estimates considered reasonable by management at the date the statements are made. Although Charbone believes that the expectations reflected in the forward-looking statements are reasonable, forward-looking statements involve risks and uncertainties, and undue reliance should not be placed on forward-looking statements, as unknown or unpredictable factors could cause actual results to be materially different from those reflected in the forward-looking statements. The forward-looking statements may be affected by risks and uncertainties in the business of Charbone. These risks, uncertainties and assumptions include, but are not limited to, those described under ‘Risk Factors’ in the Corporation’s Filing Statement dated March 31, 2022, which is available on SEDAR at www.sedar.com; they could cause actual events or results to differ materially from those projected in any forward-looking statements.

Except as required under applicable securities legislation, Charbone undertakes no obligation to publicly update or revise forward-looking information.

Neither TSX Venture Exchange nor its Regulation Services Provider (as that term is defined in policies of the TSX Venture Exchange) accepts responsibility for the adequacy or accuracy of this release .

Contact Charbone Hydrogen Corporation

Telephone: +1 450 678 7171

Email: ir@charbone.com

Benoit Veilleux

CFO and Corporate Secretary

Copyright (c) 2025 TheNewswire – All rights reserved.

News Provided by TheNewsWire via QuoteMedia

This post appeared first on investingnews.com

Quimbaya Gold Inc. (CSE: QIM) (OTCQB: QIMGF) (FSE: K05), The Next Big Gold Discovery in Columbia, is pleased to announce that it will be participating in THE Mining Investment Event, Canada’s Only Tier 1 Global Mining Investment Conference©, taking place June 3-5, 2025, at the Quebec Convention Centre, Quebec City, Canada.

Quimbaya Gold Inc.’s management will be available to meet with investors throughout the three-day conference.

‘We are particularly excited about the global audience that THE Event has attracted, showcasing the best of international mining in Canada. This is a unique chance to engage with industry leaders and innovators, facilitating discussions that will shape the future of our sector. We look forward to seeing many of you there and exploring the possibilities that await us at this prestigious gathering.’

Information regarding THE Event, including investor registration details, a list of participating companies, panelists and keynote speakers, as well as a preliminary agenda, can be found at https://www.themininginvestmentevent.com/.

About Quimbaya Gold Inc.
Quimbaya aims to discover gold resources through exploration and acquisition of mining properties in the prolific mining districts of Colombia. Managed by an experienced team in the mining sector, Quimbaya is focused on three projects in the regions of Segovia (Tahami Project), Puerto Berrio (Berrio Project), and Abejorral (Maitamac Project), all located in Antioquia Province, Colombia.

THE Event is by invitation only – Interested investors & issuers, please go here:
https://www.themininginvestmentevent.com/register or contact Jennifer Choi, jchoi@irinc.ca

About: THE Mining Investment Event—Canada’s Only Tier 1 Global Mining Investment Conference© is held annually in Québec City, Canada. It is independently sponsored and designed to facilitate privately arranged meetings between mining companies, international investors, and various mining government authorities. The conference provides a platform to hear from some of the most influential thought leaders in the sector.

THE Event is committed to promoting diversity, equality, and sustainability in the mining industry through education and innovation through its unique Student Sponsorship and SHE-Co Initiatives.

For further information:

Jason Frame
Manager of Communications
1-647-576-7135
jason.frame@quimbayagold.com

News Provided by Newsfile via QuoteMedia

This post appeared first on investingnews.com

The crypto market crash hit the investors with a sudden attack as most anticipated further recovery amid the hold on Trump Tariff and Bitcoin’s price surge. However, the investors’ sentiments changed significantly at the May end with many key macroeconomic events, including the US PCE data. Let’s discuss the key reasons behind the drop. 219K Traders Liquidated in Today’s Crypto Market Crash The crypto market cap has declined more than 3% in the last 24 hours, and investors’ sentiments on the fear and greed index have moved down to 61. Despite being in the greed zone, the impact is significant on crypto assets’ performance, including Bitcoin, as its price crashed to $104.8k earlier in the day. The same is true for most altcoins, as they followed a similar trajectory. Ethereum plummeted 3.74%, XRP price crashed 4%, Solana 5%, and Dogecoin declined 10% today. Due to this, more than 219k traders… Read More at Coingape.com

The post Crypto Market Crash: 217K Traders Liquidate and $11.6B Crypto Options Expires Today appeared first on CoinGape.

Pi coin price is on track for further downside until August, according to a popular crypto analyst. He cited the ongoing lack of transparency and insider sales, which have dragged the Pi Network token down by 60% from its highest point in May.  Pi Coin Price Could Crash Amid Transparency Concerns Pi coin price today trades at $0.6800, its lowest level since May 17, and could continue its downtrend in the next few months. In an X post, Dr. Altcoin, a popular Pi analyst, warned that it may crash to $0.40 by August. Such a move would imply a 40% drop from the current level. He cited the lack of transparency from the Pi Core Team, which is led by its founders, Nicolas Kokkalis and Chengdiao Fan. He said: “No investor wants to put money into something where the founders refuse to be transparent.” Dr. Altcoin, who has over 46k… Read More at Coingape.com

The post Analyst Warns Pi Coin Price Crash Amid Lack of Transparency & Insider Concerns appeared first on CoinGape.

James Wynn said that he will “recover all in one trade” after losing a staggering $37 million in Bitcoin bets. The crypto trader has opened a new 10x long position for PEPE Coin, and has been teasing the Moonpig meme coin on X platform. The Hyperliquid whale, who gained popularity by generating a massive $87 million profit by betting on PEPE, TRUMP, and FARTCOIN, lost all of its and more in the last three days, on his Bitcoin bets. As per data by On-Chain College, these losses amount to $37 million, including fees. Will James Wynn Succeed With PEPE and Moonpig? Crypto trader James Wynn is back to betting on his favourite meme coin PEPE, which helped him mint millions in fortune. Furthermore, by tweeting the image of moonpig, the crypto trader wrote: “I’ll make it all back in one trade”. I’ll make it all back in one trade $moonpig… Read More at Coingape.com

The post James Wynn: “I’ll Make It All Back In One Trade”, Bets Big on PEPE and Moonpig appeared first on CoinGape.