Archive

April 2025

Browsing

NVIDIA (NVDA) has allocated $500 billion for US AI investment, but Jim Cramer cites it as the meme stock. Surprisingly, the NVIDIA stock price failed to react to this bullish news, showcasing investors’ declining interest in the asset. Although the Trump tariff fear is persistent, experts fear Cramer’s take might be true for this AI company.

JIM Cramer Calls NVIDIA ‘Meme Stock’ After Price Struggles

NVIDIA has announced a $500 billion investment in the US AI sector over the next four years. The GPU manufacturing company aims to strengthen the country’s AI infrastructure and reduce reliance on international supply chains.

Interestingly, this decision comes following Donald Trump’s tariff introduction on US imports.  Although this is bullish news as it will create thousands of jobs in America, the investors remained less optimistic.

The NVIDIA stock price rose barely 3% with the $500 billion investment news before losing momentum. It currently trades at $110.71 and has crashed significantly with Trump’s tariff affecting the stock market.

Considering the NVDA’s performance struggle, Jim Cramer has called it a meme stock. In the recent CNBC post, Cramer revealed his top stock picks to buy but also targeted Apple, NVIDIA, and a few other companies for poor share performance.

The post mentioned that Cramer believes NVDA had become a meme before saying that he didn’t own meme stock. Again, he commented on NVIDIA’s failure to rise with the $500 billion announcement, adding that it should have broken out, but it did not as the meme crowd controls it.

Yesterday the “Chinese” stocks did quite well. They aren’t supposed to be. Yesterday Nvidia should have broken out, but it is being so seriously controlled by the meme crowd that it couldn’t rally.

Is Jim Cramer Right About NVIDIA Stock?

NVIDIA stock had a slower start and struggled with its price performance for years before the AI industry began to boom. After that, the stock grew higher and higher, setting its prime at $149.43 at the beginning of the year.

Considering the broader picture, NVDA’s meme stock stage seems momentary, as it is struggling just like the rest of the crypto stock prices. More importantly, it has the potential to rise amid the growing demand for the artificial intelligence system.

Notably, Trump’s tariff could influence its performance negatively. Additionally, few analysts believe that the NVIDIA price crash is imminent, but the long-term bullish outlook remains persistent.

Beasides, if Jim Cramer’s Cramer index is considered, this could be a buying opportunity, where the stocks he derogate performance wells.

The post Is Jim Cramer Right About NVIDIA as Stock Price Fails to React to $500B Investment Plan? appeared first on CoinGape.

Kraken Team of Janover:- A lot has happened with Janover (NASDAQ: JNVR) in the few past days. One of the leading crypto exchanges, Kraken, invested in its private offering fundraising of $42 million last week.

With other investors including Pantera Capital, Arrington Capital, the AI-powered real estate lending firm is also focusing on its Solana Treasury strategy. It is slowly aiming to transition from a fintech company to Web3 pioneer in DeFi.

This all is happening after an all-former Kraken team acquired majority ownership in the company on April 7. The press release revealed the reason to be for “bridging the liquidity gap between Traditional Finance and Decentralised Finance.” In fact, Janover is soon set to rename to “DeFi Development Corporation” with a new ticker symbol.

But, let’s come straight to the point:- Why are former Kraken Executives Interested in Janover? Before it, the firm was purely AI platform focused on connecting the lenders and borrowers in the real estate market.

Decoding the Acquisition by Kraken Team

The Kraken team has notably bought 728,632 shares of Janover common stock with its share witnessing a whopping 1,000% surge soon after it unveiled its treasury strategy. The impressive market performance highlights the bullish response on its DeFi amibitions and transitions.

A CNBC report compared its renewed ambitions with that of becoming the next “MicroStrategy” but for Solana. As of April 13, 2025, MicroStrategy – now operating under the name Strategy – holds 531,644 bitcoins,

Janover’s bid is evident on the surface. It is following a bold new treasury strategy architected by former Kraken management executives.

As part of its new Treasury Strategy, Janoger on April 11 completed purchase of $5 million of Solana (SOL) tokebs. This brings its total Solana holdings to 83,084 worth $9.6 million. It immediately started staking it’s SOL immediately for revenue yields.

JNVR SOL Holdings

Further, Janover operates in the $3 trillion+ U.S. commercial real estate (CRE) sector—a space that’s historically underserved by tech.

This gives Kraken-aligned investors a “real-world asset” (RWA) entry point. The company plans to rename itself to DeFi Development Corporation, signaling a serious pivot to Web3-first business models.

Notably, Kraken recently expanded to TradFi with the launch of Stock & ETF Trading.

As part of the transition, Janover aims to become the first U.S.-listed company offering public market investors direct exposure to Solana’s ecosystem.

The Company also aims to operate one or more Solana validators. This is aimed at enabling it to stake its treasury assets, participate in securing the network, and earn rewards that can be reinvested.

The broader goal, according to the company, is to build a transparent, long-term value engine that compounds net asset value (NAV) and serves as a scalable gateway to DeFi within public equity markets.

Notably, as per the revelation, Janover isn’t pivoting away from its core—it’s enhancing its fintech model with blockchain principles.

JNVR Stock Since Acquisiition

Who are the Kraken Team Members Leading Janover Now?

Following the acquisition, the Board of Directors appointed Joseph Onorati as Chairman and CEO, and Parker White as Chief Investment Officer and Chief Operating Officer.

The new leadership, including Joseph Onorati as CEO and Parker White as CIO/COO, brings extensive experience from the crypto industry.

1. Joseph Onorati served as Chief Strategy Officer at Kraken Digital Asset Exchange. He also founded and led a high-frequency crypto market maker and briefly served as interim CEO at CaVirtEx, Canada’s first Bitcoin exchange, which was acquired later by Kraken.

2. Parker White was the Director of Engineering at Kraken Digital Asset Exchange. He currently operates a Solana validator with $75 million in delegated stake and previously managed a $2 billion bond portfolio at an institutional investment firm.

Additionally, Marco Santori, former Chief Legal Officer at Kraken, has also joined Janover’s Board of Directors.

However, Janover’s founder, Blake Janover, and Director and Audit Committee Chair William Caragol continue to on the board to ensure continuity in the company’s operations.

Notably, Janover isn’t a whitepaper project — it’s a revenue-generating commercial lending platform in a $3T+ real estate market. This proves to be a safer bet for Kraken Team than pure crypto startups – for leading and securing space in DeFi.

Next Microstrategy?

Janover is making this transition at a strategic time. With institutions warming up to stablecoins, tokenized U.S. Treasuries, DeFi yield products, it can have an edge in its ambitions.

Janover’s treasury pivot could position it as a leader in real-world asset integration, which Kraken-affiliated strategists are likely bullish on.

But it is still to early to see it in par with Microstrategy. Investors can keep an eye as its future plans unfold.​

The post Kraken Alums Drive Janover’s New Treasury Strategy – Is the Next MicroStrategy in the Making? appeared first on CoinGape.

Bitcoin price has shed 21% of its value from its record high of around $108,000 recorded in January 2025. Despite the uncertainty, Strategy (formerly MicroStrategy), which is currently the fourth-largest Bitcoin holder, has continued to accumulate. However, as the price inches lower, Strategy’s $44 billion BTC portfolio is at risk of dropping below the average buying price of $67,556. If this happens, what would happen to the company’s 531,644 BTC? Let’s explore. 

Why Bitcoin Price Drop Below $67K Threatens Michael Saylor’s Strategy 

Bitcoin price today trades at $85,550. Meanwhile, Strategy’s average buying price for its $44 billion Bitcoin portfolio is $67,556 per data from Strategy Tracker. This means that at the current BTC price, Strategy is 26% above water and sitting on $9 billion in unrealized profits. 

However, the most recent Bitcoin purchase by Strategy drew criticism from Bitcoin critic Peter Schiff who observed that each new purchase takes the company closer to making losses. He opined, 

“At the moment you still have about a 25% paper gain. By soon your average cost will be above the market price, meaning your entire Bitcoin position will be held at a loss.” 

Schiff’s comments come after popular market analyst Whale Panda criticized Strategy’s plan to buy Bitcoin using debt. The analyst stated that Saylor would likely trigger the next Bitcoin bear market if he fails to get the cash needed to pay off the debt offerings used to fund MicroStrategy’s BTC accumulation. 

Moreover, last week, an SEC filing by Strategy emerged stating that if BTC price continues to decline, Strategy might sell Bitcoin at a loss to meet its financial obligations. This means that if Bitcoin falls below $67,000 and MicroStrategy is required to pay off debt, it will have to start liquidating BTC and end Saylor’s HODL strategy. 

Strategy SEC Filing

The possibility of MicroStrategy going underwater explains why $67,000 matters to Saylor’s Bitcoin plan and Strategy’s business model. 

What Happens to Strategy’s $44B BTC if Price Drops Below $67,000? 

The impact that the drop in Bitcoin price below $67,000 would have on Strategy’s $44 billion BTC portfolio depends on whether such a dip is temporary or sustained. If Bitcoin briefly retests $67K but bounces back above Strategy’s average buying price, the company may not face a liquidation risk. However, this dip may create market FUD.

On the other hand, if Bitcoin price drops to $67,000 and sustains the drop to retest lower levels, Strategy will face liquidation and credit risk. In its recent SEC filing, the company stated, 

“These risks could materialize at times when Bitcoin is trading below its carrying value on our most recent balance sheet or our cost basis.” 

The resulting selloff will trigger market-wide fear and panic, causing retail traders to also dump their holdings. This may also create a black swan effect across the crypto market. 

These scenarios highlight why Bitcoin needs to hold above $67,000 to ensure MicroStrategy’s $44 billion Bitcoin portfolio does not suffer losses. 

Bitcoin Technical Analysis 

On-chain and technical data show a bullish Bitcoin price prediction, which may prevent a dip to $67,000. Analyst Miles Deutscher observed that BTC has broken out of a descending trendline for the first time since it fell from its ATH in January. 

This breakout suggests that the downtrend is weakening. If Bitcoin sustains this bullish breakout, it could result in additional gains. 

BTC/USD: 1-day Chart

At the same time, IntoTheBlock data shows that on April 14, more than $465M BTC was withdrawn from exchanges, signaling accumulation. If the technical and on-chain data remains strong, it may prevent Bitcoin from falling below Strategy’s average buying price of $67,000, avoiding the liquidation risk.

The post Here’s What Would Happen to Strategy’s $44B BTC if Bitcoin Price Crashes Below $67K appeared first on CoinGape.

XRP price has recorded marginal gains today and held its $2.15 support as the broader crypto market stayed in the green. Amid this, a top analyst revealed that Ripple’s coin may have already hit its bottom. However, he also highlighted some key conditions that the crypto must attain to confirm the bottom.

Meanwhile, another expert has also shared key insights and mathematical calculations, which showed how Ripple’s native crypto might hit the $15 ahead.

XRP Price Holds $2.15 Support: Has It Already Bottomed Out?

XRP price has added around 0.23% during writing and exchanged hands at $2.15, while its one-day volume fell 25% to $2.99 billion. Notably, the crypto’s current market cap stood at $125.33 billion and the token has touched a 24-hour high of $2.18.

Besides, CoinGlass data showed that XRP Futures Open Interest also rose 0.5%, reflecting renewed market confidence. Amid this, renowned analyst EGRAG CRYPTO suggests that XRP might have already hit its bottom on April 7. However, the analyst outlines some key conditions to confirm this trend reversal.

XRP Really Bottomed?

According to the pundit, Ripple’s coin must close a weekly full-body candle above $2.10, the 21-week EMA, and notably above $2.25. If these conditions are met, it would strongly confirm the bottoming out of XRP price. However, failure to achieve these conditions may lead to other market narratives emerging, the expert noted.

Source: EGRAG CRYPTO, X

Meanwhile, despite the soaring discussions, another expert recently hinted that the crypto might hit $15, citing XRP ETF inflow as the key factor.

Ripple’s Coin To Hit $15? ETF Inflow Calculation Shows

In a recent analysis, market expert Zach Rector made a bold prediction that XRP price could reach $15 and beyond, driven by anticipated inflows from Exchange-Traded Funds (ETFs). According to Rector, JPMorgan’s estimate of $4 to $8 billion inflows into XRP ETFs in the first year could trigger a significant price surge.

A Closer Look Into The Calculation

Using his market cap multiplier model, Rector calculated that a conservative $4 billion inflow could lead to a 200x multiplier, resulting in an $800 billion increase in XRP’s market cap. Adding this to the current market cap of $125 billion would take the total market cap to $925 billion. With a circulating supply of 60 billion XRP tokens, this would translate to a price of $15.42 per token.

Rector’s analysis is based on the market cap multiplier theory, which measures how inflows can amplify an asset’s valuation. He cited a recent example where XRP’s market cap grew by $7.74 billion in just eight hours, fueled by a mere $12.87 million in inflows, resulting in a 601x multiplier.

While Rector’s prediction seems ambitious, industry leaders are growing more confident about the prospect of an XRP ETF. Ripple CEO has predicted that at least one XRP ETF could launch in the second half of 2025. If Rector’s analysis is correct, the anticipated ETF inflows could trigger a significant rally for XRP price, making $15 a realistic target.

Meanwhile, this also comes as Ripple’s coin continues to witness an influx, outshining BTC, ETH, SOL, and others. A recent report showed that XRP defied the broader market trend last week when the broader digital assets space noted an outflux of over $790 million.

Additionally, a recent Ripple price analysis also showed that the XRP ETF launch, among other factors, could trigger a short-term surge to $5.5 for the crypto. However, investors should exercise caution and conduct their own research before making any investment decisions.

But, this prediction seems to have sparked interest in the crypto community, with many eagerly awaiting the potential launch of XRP ETFs in 2025.

The post Has XRP Price Already Bottomed? Analyst On How Ripple Coin Can Hit $15 appeared first on CoinGape.

Tether, the issuer of the USDT stablecoin, has invested in Fizen Limited. Finzen is a fintech company that focuses on self-custody crypto wallets and digital payments.

The investment will support Fizen’s development of solutions that allow stablecoin transactions for consumers and businesses.

Tether to Address Financial Inclusion Through Stablecoin Technology

As outlined in the announcement, Fizen uses payment technologies to facilitate stablecoin transactions and incorporate crypto use cases into day-to-day actions.

The partnership is looking to counter the issues identified in the World Bank’s Global Findex Report on the many millions of people around the world who do not currently have access to bank accounts, because of issues with the distance they are from financial institutions and documentation that is required to open a bank account.

The partnership between Tether and Fizen intends to provide a bridge between cryptocurrency and traditional payments. This will allow individuals to pay using their stablecoins like USDT while merchants receive fiat settlements via payments through a QR code, card reader, or existing financial services. USDT coin has a market cap of $144.5 billion and currently trades at a price of $0.9998.

Stablecoins like USDT have better stability and maintain their peg even with cryptocurrencies that have high volatility. Check out our USDT April 2025 price prediction to understand how the stablecoin could likely perform.

The investment will allow Fizen to improve its blockchain capabilities and allow the integration of stablecoins across multiple blockchain ecosystems. According to the announcement, users will gain access to more efficient ways to store, transfer, and transact using stablecoins without facing restricted access or complicated documentation requirements.

Tether CEO States The Importance of This Investment

Tether’s CEO Paolo Ardoino highlighted the importance of the investment. He stated, “Tether’s investment in Fizen underscores our commitment to expanding global access to efficient and reliable digital financial solutions that promote the informed responsible use of digital assets in everyday life.” He added that Tether recognizes the important role of self-custodial payment infrastructure in driving real-world use cases.

The World Bank’s Global Findex Report identifies key barriers that prevent millions from accessing traditional banking services. Particularly, this includes physical distance to financial institutions and documentation requirements.

Nevertheless, stablecoins are not without their difficulties in real-world applications for commerce. Fizen believes they can resolve these issues by enabling users to pay with stablecoins while permitting merchants to receive fiat settlements through established payment rails like QR codes and card readers.

The Fizen approach does away with the need for extra infrastructure. In several market forecasts referenced in the release, QR code payments expect to surpass $3 trillion and have 2.2 billion users by 2025, with increased smartphone adoption and convenience in making digital transactions fueling this growth substantially. Notably, the announcement for the partnership follows Tether’s USDT being approved as a legal cryptocurrency last month in Thailand.

The post Tether Invests in Fizen to Expand Stablecoin Adoption and Self-Custody Solutions appeared first on CoinGape.

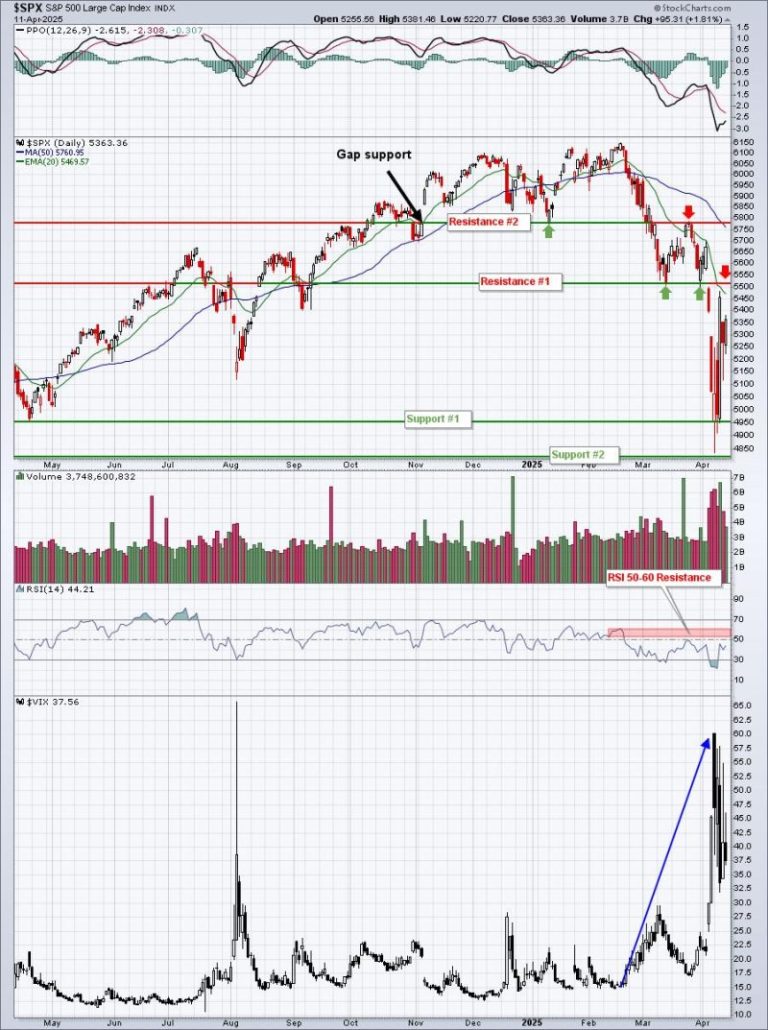
I pay attention to technical support levels as the combination of price support/resistance is always my primary stock market indicator. We’re in a downtrend and, in my opinion, the trading range is very, very clear on the S&P 500 right now:

I think most everyone can agree that much of the selling and fear and panic can be attributed the trade war – at least much of the weakness occurred with startling tariff news. So I figured I’d take a look at Q4 2018, which also experienced a 2-3 month bear market with the S&P 500 just barely reaching the prerequisite 20% drop. Here’s what that looked like:

The chart pattern during Q4 2018 was quite similar. The VIX more than tripled from under 12 to above 36. The VIX also more than tripled in 2025, after starting from a much higher level near 15. In both 2018 and 2025, that initial selling episode saw a drop of roughly 10% before consolidating. Then the next drop was another 10% or so. We don’t know if the selling for 2025 has ended, though, as that’s the wild card.

Here’s what we do know about sentiment. The VIX, with a value in the 50s, is signaling a potential S&P 500 bottom. Historically, surges in the VIX to this level or higher, have coincided either with stock market bottoms or they at least they suggest that any future selling in the S&P 500 is likely to be minor. Here’s a long-term monthly chart of the S&P 500 and the VIX, showing this relationship:

Extreme fear marks bottoms and I believe this is a great visual to support this belief. History tells us that when the VIX tops, we’ve either bottomed or we’re very close to bottoming.

Late last week, we saw both the March Core CPI and March Core PPI come in well below expectations, which was a good result for those hoping for rate cuts to begin again later this year. On Friday, a lot of folks were talking very bearish after the University of Michigan consumer sentiment plummeted to a near 50-year low. The problem with that bearish line of thinking is that sentiment is a contrarian indicator. Bearish readings tend to be quite bullish for stocks, while bullish readings can mark significant tops. Don’t believe me? Check out this chart and then provide me your best bearish argument:

The low readings in the green-shaded areas are actually very bullish. You can’t argue with history and facts. When the general public is feeling despair, it’s the time to buy stocks, not sell. And for those who believe this time is different, let’s check back in one year from now and let’s see where we are.

Note one more thing. The absolute highest consumer sentiment reading was at the beginning of 2000, just before the dot com bubble burst. Everyone felt great back then and the S&P 500 didn’t make a meaningful new all-time high for 13 years. So you tell me, would you rather see sentiment strength or weakness?

I know it sounds awful to hear that consumer sentiment readings are among the lowest in history and it likely makes little sense to many why the stock market would go higher while sentiment is so negative. But you have to remember that the stock market looks 6-9 months ahead. It’s not concerned with the news coming out now. It’s much more concerned about what the market environment will look like later this year.

Here’s my last point for today. We’ve begun to see more bullish rotation among sectors and between growth and value. Let me show you one final chart that highlights the rotation into growth as the S&P 500 continues its descent:

Notice the S&P 500 made its final high in February as money rotated quickly from growth to value in the two months prior. That was Wall Street exiting the riskier areas of the market, when everything still looked fine. It was one of the many reasons why I turned cautious and moved to cash in late January. Now the opposite is occurring. The S&P 500 is downtrending and the news just keeps getting worse. Meanwhile, Wall Street is happily buying all the risky shares you’d like to sell.

Listen, I’ve been wrong before and maybe I’m wrong and the S&P 500 continues to decline throughout 2025. But I trust my review of the market and my signals that have worked so well for me in the past. I’m perfectly fine owning stocks right now.

Tomorrow morning, in our free EB Digest newsletter, I’ll be showing everyone the extreme manipulation that’s been taking place in the stock market the past 4 weeks or so. Market makers are stealing (legally) from all of us. I spotted this manipulation back in June 2022, which helped me to go against the grain and call the market bottom then and I’m seeing it again now. To learn more, be sure to CLICK HERE and sign up for our FREE EB Digest newsletter, if you haven’t already. There’s no credit card required and you may unsubscribe at any time.

Happy trading!

Tom

This week has brought ups and downs for the gold price as US President Donald Trump’s tariff decisions continue to create widespread uncertainty across sectors globally.

The yellow metal started the week at about US$3,020 per ounce, but quickly tumbled below the US$3,000 level as markets around the world took a beating.

Although gold is known as a safe haven, it’s common for it to fall in tandem with other assets during widespread downturns. The idea is that gold won’t drop as hard and will recover more quickly.

Speaking just after gold’s fall, Gary Wagner of TheGoldForecast.com explained that its decline shouldn’t be concerning for investors. Here’s how he explained it:

‘One thing that is clear is that when equities came under fire … liquidation happened across the board in multiple asset groups and classes. Gold was kind of a witness to that, and the massive liquidation that occurred was either to liquidate profitable positions to cover margin calls, or just to get more into cash than they had been in terms of the position of the portfolio. So to me it’s not that unexpected, and the amount of the decline is actually fairly calm considering how much it’s gone up.’

Wagner’s advice not to worry about gold’s pullback was prescient — the precious metal was back on the move by Wednesday (April 9), and on Thursday (April 10) it notched yet another fresh all-time high.

It continued moving upward on Friday (April 11), breaking US$3,200 and setting another price record.

Gold’s midweek rebound came after Trump’s turnaround on tariffs — in a surprise move on Wednesday, he announced a 90 day pause on ‘reciprocal’ tariffs for most countries.

China is an exception — Trump said he would be boosting China’s rate to 125 percent after the Asian nation announced further retaliatory tariffs against the US. It’s since been clarified that tariffs on China stand at 145 percent; on Friday, China said it would raise its tariffs on the US to 125 percent.

Canada and Mexico are also exceptions. Most goods from these countries are already subject to 25 percent tariffs, and these will remain in place. Blanket 25 percent tariffs on cars and car parts, as well as steel and aluminum, have also not been affected at this point.

The reversal from Trump came not long after he encouraged his followers on Truth Social to ‘be cool’ and told them it was ‘a great time to buy.’ It also reportedly came after White House officials put increasing pressure on Trump to change course. Worries about a selloff in US government bonds raised alarm bells, with Treasury Secretary Scott Bessent taking these concerns to Trump.

‘The bond market is very tricky, I was watching it. The bond market right now is beautiful. But yeah, I saw last night where people were getting a little queasy’ — Trump

Major US indexes rebounded strongly once Trump announced his decision, and although they had given up some gains by the end of the week, they still finished the period in the green.

In terms of where that leaves gold, many experts with agree its prospects still look bright even as it trades at all-time highs. Here’s what Will Rhind of GraniteShares said:

‘If you look at something called the M2 ratio, which is the money supply divided by the price of gold, that is a particularly scary chart. Obviously if history is any guide, then when the ratio is high, that typically means that gold is overvalued, and when the ratio is low, that typically means that gold is undervalued.

‘If you look at it right now, we’re somewhat I would say below the median. In other words, we’re closer to gold being undervalued rather than overvalued at a time when we just talked about gold hitting a new all-time high.’

Securities Disclosure: I, Charlotte McLeod, hold no direct investment interest in any company mentioned in this article.

This post appeared first on investingnews.com

Silver-mining companies and juniors have seen support from a strong silver price in 2025. Since the start of the year, the price of silver has increased by over 11 percent as of April 11, and it reached a year-to-date high of US$34.38 per ounce on March 27.

Silver’s dual function as a monetary and industrial metal offers great upside. Demand from energy transition sectors, especially for use in the production of solar panels, has created tight supply and demand forces.

Demand is already outpacing mine supply, making for a positive situation for silver-producing companies.

So far, aboveground stockpiles have been keeping the price in check, but the expectation is those stocks will be depleted in 2025 or 2026, further restricting the supply side of the market.

How has silver’s price movement benefited Canadian silver stocks on the TSX, TSXV and CSE? The five companies listed below have seen the best performances since the start of the year. Data was gathered using TradingView’s stock screener on February 12, 2025, and all companies listed had market caps over C$10 million at that time.

1. Discovery Silver (TSX:DSV)

Year-to-date gain: 185.92 percent
Market cap: C$848.98 million
Share price: C$2.03

Discovery Silver is a precious metals development company focused on advancing its Cordero silver project in Mexico. Additionally, it is looking to become a gold producer with its recently announced acquisition of the producing Porcupine Complex in Ontario, Canada.

Cordero is located in Mexico’s Chihuahua State and is composed of 26 titled mining concessions covering approximately 35,000 hectares in a prolific silver and gold mining district.

A 2024 feasibility study for the project outlines proven and probable reserves of 327 million metric tons of ore containing 302 million ounces of silver at an average grade of 29 grams per metric ton (g/t) silver, and 840,000 ounces of gold at an average grade of 0.08 g/t gold. The site also hosts significant zinc and lead reserves.

The report also indicated favorable economics for development. At a base case scenario of US$22 per ounce of silver and US$1,600 per ounce of gold, the project has an after-tax net present value of US$1.18 billion, an internal rate of return of 22 percent and a payback period of 5.2 years.

Discovery’s shares gained significantly on January 27, after the company announced it had entered into a deal to acquire the Porcupine Complex in Canada from Newmont (TSX:NGT,NYSE:NEM).

The Porcupine Complex is made up of four mines including two that are already in production: Hoyle Pond and Borden. Additionally, a significant portion of the complex is located in the Timmins Gold Camp, a region known for historic gold production.

Discovery anticipates production of 285,000 ounces of gold annually over the next 10 years and has a mine life of 22 years. Inferred resources at the site point to significant expansion, with 12.49 million ounces of gold, from 254.5 million metric tons of ore with an average grade of 1.53 g/t.

Upon the closing of the transaction, Discovery will pay Newmont US$200 million in cash and US$75 million in common shares, and US$150 million of deferred consideration will be paid in four payments beginning on December 31, 2027.

According to Discovery in its full-year 2024 financial results, the Porcupine acquisition will help support the financing, development and operation of Cordero. Discovery’s share price reached a year-to-date high of C$2.12 on March 31.

2. Almaden Minerals (TSX:AMM)

Year-to-date gain: 136.36 percent
Market cap: C$16.47 million
Share price: C$0.13

Almaden Minerals is a precious metals exploration company working to advance the Ixtaca gold and silver deposit in Puebla, Mexico. According to the company website, the deposit was discovered by Almaden’s team in 2010 and has seen more than 200,000 meters of drilling across 500 holes.

A July 2018 resource estimate shows measured resources of 862,000 ounces of gold and 50.59 million ounces of silver from 43.38 million metric tons of ore, and indicated resources of 1.15 million ounces of gold and 58.87 million ounces of silver from 80.76 million metric tons of ore with a 0.3 g/t cutoff.

In April 2022, Mexico’s Supreme Court of Justice (SCJN) ruled that the initial licenses issued in 2002 and 2003 would be reverted back to application status after the court found there had been insufficient consultation when the licenses were originally assigned.

Ultimately, the applications were denied in February 2023, effectively halting progress on the Ixtaca project. While subsequent court cases have preserved Almaden’s mineral rights, it has yet to restore the licenses to continue work on the project.

In June 2024, Almaden announced it had confirmed up to US$9.5 million in litigation financing that will be used to fund international arbitrations proceedings against Mexico under the Comprehensive and Progressive Agreement for Trans-Pacific Partnership.

In a December update, the company announced that several milestones had been achieved, including the first session with the tribunal, at which the company was asked to submit memorial documents outlining its legal arguments by March 20, 2025. At that time, the company stated it would vigorously pursue the claim but preferred a constructive resolution with Mexico.

In its most recent update on March 21, the company indicated that it had submitted the requested documents, claiming US$1.06 billion in damages. The memorial document outlines how Mexico breached its obligations and unlawfully expropriated Almaden’s investments without compensation.

Shares in Almaden reached a year-to-date high of C$0.135 on February 24.

3. Avino Silver & Gold Mines (TSX:ASM)

Year-to-date gain: 98.43 percent
Market cap: C$373.48 million
Share price: C$2.52

Avino Silver and Gold Mines is a precious metals miner with two primary silver assets: the producing Avino silver mine and the neighboring La Preciosa project in Durango, Mexico.

The Avino mine is capable of processing 2,500 metric tons of ore per day ore, and according to its FY24 report released on January 21 the mine produced 1.1 million ounces of silver, 7,477 ounces of gold and 6.2 million pounds of copper last year. Overall, the company saw broad production increases with silver rising 19 percent, gold rising 2 percent and copper increasing 17 percent year over year.

In addition to its Avino mining operation, Avino is working to advance its La Preciosa project toward the production stage. The site covers 1,134 hectares, and according to a February 2023 resource estimate, hosts a measured and indicated resource of 98.59 million ounces of silver and 189,190 ounces of gold.

In a January 15 update, Avino announced it had received all necessary permits for mining at La Preciosa and begun underground development at La Preciosa. It is now developing a 350-meter mine access and haulage decline. The company said the first phase at the site is expected to be under C$5 million and will be funded from cash reserves.

The latest update from Avino occurred on March 11, when it announced its 2024 financial results. The company reported record revenue of $24.4 million, up 95 percent compared to 2023. Avino also reduced its costs per silver ounce sold.

Additionally, Avino reported a 19 percent increase in production in 2024, producing 1.11 million ounces of silver compared to 928,643 ounces in 2023. The company’s sales also increased, up by 23 percent to 2.56 million ounces of silver compared to 2.09 million ounces the previous year.

Avino’s share price marked a year-to-date high of C$2.80 on March 27.

4. Highlander Silver (CSE:HSLV)

Year-to-date gain: 90 percent
Market cap: C$160.17 million
Share price: C$1.90

Highlander Silver is an exploration and development company advancing projects in South America.

Its primary focus has been the San Luis silver-gold project, which it acquired in a May 2024 deal from SSR Mining (TSX:SSRM,NASDAQ:SSRM) for US$5 million in upfront cash consideration and up to an additional US$37.5 million if Highlander meets certain production milestones.

The 23,098 hectare property, located in the Ancash department of Peru, hosts a historic measured and indicated mineral resource of 9 million ounces of silver, with an average grade of 578.1 g/t, and 348,000 ounces of gold at an average grade of 22.4 g/t from 484,000 metric tons of ore.

In July 2024, the company said it was commencing field activities at the project; it has not provided results from the program. In its December 2024 management discussion and analysis, the company stated it was undertaking a review of prior exploration plans and targets, adding that it believes there is exceptional growth potential.

Highlander’s most recent news came on March 11, when it announced it had closed an upsized bought deal private placement for gross proceeds of C$32 million. The company said it will use the funding to further exploration activities at San Luis and for general working capital.

Shares in Highlander reached a year-to-date high of C$1.96 on March 31.

5. Santacruz Silver Mining (TSXV:SCZ)

Year-to-date gain: 85.45 percent
Market cap: C$192.16 million
Share price: C$0.51

Santacruz Silver is an Americas-focused silver producer with operations in Bolivia and Mexico. Its producing assets include the Bolivar, Porco and Caballo Blanco Group mines in Bolivia, along with the Zimapan mine in Mexico.

In a production report released on January 30, the company disclosed consolidated silver production of 6.72 million ounces, marking a 4 percent decrease from the 7 million ounces produced in 2023. This decline was primarily attributed to a reduction in average grades across all its mining properties.

In addition to its producing assets, Santacruz also owns the greenfield Soracaya project. This 8,325-hectare land package is located in Potosi, Bolivia. According to an August 2024 technical report, the site hosts an inferred resource of 34.5 million ounces of silver derived from 4.14 million metric tons of ore with an average grade of 260 g/t.

Shares in Santacruz reached a year-to-date high of C$0.59 on March 18.

Securities Disclosure: I, Dean Belder, hold no direct investment interest in any company mentioned in this article.

This post appeared first on investingnews.com

Spearmint Resources Inc. (CSE: SPMT) (OTC Pink: SPMTF) (FSE: A2AHL5) (the ‘Company’ or ‘Spearmint’) wishes to announce that it has significantly increased the acreage of the ‘Sisson North Tungsten Project’ in New Brunswick directly bordering the Sisson Tungsten Mine. This new project now consists of approximately 4,890 contagious acres increased from 2,582 prospective for tungsten.

James Nelson, President of Spearmint stated, ‘There continues to be strong demand for commodities caught in the middle of global tariff battles—particularly tungsten. Considering these developments, we believe there will be increasing emphasis on securing domestic sources of strategic materials. With commodity prices remaining elevated and gold at all-time highs, we anticipate a much more buoyant junior mining market. With multiple active projects, Spearmint is well positioned to take advantage of these market conditions.’

​In April 2025, China’s export controls on tungsten continued to impact global supply chains and market dynamics. These measures, initiated in February, require exporters to obtain licenses for shipping tungsten and other critical minerals abroad, citing national security and non-proliferation concerns.​

The restrictions have led to increased prices and supply uncertainties, particularly affecting industries reliant on tungsten, such as defense and clean energy sectors. Analysts anticipate that Chinese-supplied tungsten may be scarce in the global markets.

In response to these challenges, companies and countries are exploring alternative sources and strategies to mitigate the impact of China’s export controls on tungsten.

Tungsten has always been a valuable material due to its unique properties, such as its extremely high melting point, strength, and durability. It is used in a wide variety of applications, including manufacturing hard metals, electronics, lightbulb filaments, and in military and aerospace technologies. However, China’s actions regarding tungsten have made it even more valuable for several reasons.

In short, the combination of China’s tightening control over tungsten production and the growing demand for this critical material has made tungsten even more valuable on the global market.

Qualified person for mining disclosure:

The technical contents of this release were reviewed and approved by Frank Bain, PGeo, a director of the company and qualified person as defined by National Instrument 43-101.

About Spearmint Resources Inc.

Spearmint’s projects include four projects in Clayton Valley, Nevada: the 1,136-acre McGee lithium clay deposit, which has a resource estimate of 1,369,000 indicated tonnes and 723,000 inferred tonnes of lithium carbonate equivalent (LCE) for a total of 2,092,000 tonnes of LCE, directly bordering Pure Energy Minerals & Century Lithium Corp.; the 280-acre Elon lithium brine project, which has access to some of the deepest parts of the only lithium brine basin in production in North America; the 124-acre Green Clay lithium project; and the 248-acre Clayton Ridge gold project, the 4,722-acre George Lake South Antimony Project in New Brunswick and the 4,890 acre Sisson North Tungsten Project.

This project was acquired via staking.

For a cautionary note and disclaimer on the crypto diversification, please refer to the news release dated November 12, 2024.

Contact Information
Tel: 1604646-6903
www.spearmintresources.ca

info@spearmintresources.ca

‘James Nelson’
President
Spearmint Resources Inc.

The CSE has not reviewed and does not accept responsibility for the adequacy or accuracy of the content of this release.

To view the source version of this press release, please visit https://www.newsfilecorp.com/release/248370

News Provided by Newsfile via QuoteMedia

This post appeared first on investingnews.com

Osisko Metals Incorporated (the ‘ Company or ‘ Osisko Metals ‘) ( TSX-V: OM ; OTCQX: OMZNF ; FRANKFURT: 0B51 ) is pleased to announce initial drilling results from the 2025 drilling program at the Gaspé Copper Project, located in the Gaspé Peninsula of Eastern Québec. Results for five holes are reported below, collared at the southern margin of the mineralized deposit as defined in the 2024 Mineral Resource Estimate (MRE, see attached map and November 14, 2024 news release ).

Highlights (see Table 1 below):

  • Drill hole 30-1059 intersected 300.0 metres grading 0.39% Cu and 3.17 g/t Ag within the 2024 MRE model where there was limited historical data.
  • Drill hole 30-1060 intersected 220.5 metres grading 0.29% Cu and 2.09 g/t Ag within the 2024 MRE model, as well as 211.0 metres grading   0.42% Cu and 2.27 g/t Ag at depth below the 2024 MRE model, extending mineralization to a vertical depth of 598 metres.
  • Drill hole 30-1063 intersected 109.5 metres grading 0.32% Cu and 2.52 g/t Ag within the 2024 MRE model, as well as 61.5 metres grading   0.33% Cu and 2.60 g/t Ag, and 43.5 metres grading   0.48% Cu and 3.20 g/t Ag at depth below the 2024 MRE model, extending mineralization to a vertical depth of 678 metres.
  • Drill hole 30-1069 intersected 237.0 metres grading 0.32% Cu and 2.46 g/t Ag within the 2024 MRE model, as well as 148.8 metres grading   0.63% Cu and 4.40 g/t Ag at depth below the 2024 MRE model, extending mineralization to a vertical depth of 528 metres.
  • Drill hole 30-947, an un-assayed historical hole located 110 metres south of the 2024 MRE model, was stockpiled on site and the core recovered and assayed, yielding five significant intersections, including 82.0 metres grading 0.31% Cu and 2.55 g/t Ag. These results indicate that the deposit is open to the south.

Robert Wares, Osisko Metals CEO, commented: ‘We are very pleased with these new drill results at Gaspé, which have exceeded our expectations. All holes intersected significant disseminated mineralization within the volume of the 2024 MRE model, and new mineralization has been added at depth well below the base of the 2024 MRE model, which was constrained to the lower contact of the C Zone skarn horizon. Drill core from historical hole 30-947 was also recovered and assayed, yielding positive results and indicating that the deposit extends laterally 110 metres south of the 2024 MRE model and remains open in that direction. This is an excellent start to the 2025 drill program, and we look forward to a regular flow of results from our 110,000-metre program as we confirm our large existing copper resource, and aim to expand it at depth, to the south and to the west towards Needle Mountain.’

Table 1: Drill Hole Mineralized Intervals; intersections indicated in bold occur outside the November 2024 MRE model. See attached map for drill hole locations.

DDH No.

From To Intersection Cu Ag Mo
(m) (m) (m) % g/t %
30-0947 41.0 106.0 65.0 0.17 1.49
And 159.5 194.0 34.5 0.30 2.13
And 229.0 311.0 82.0 0.31 2.55
And 408.0 444.9 36.9 0.34 2.98 0.010
And 485.5 533.5 48.0 0.33 2.85
30-1059 8.0 308.0 300.0 0.39 3.17
And 501.0 535.0 34.0 0.28 2.33
30-1060 26.0 246.5 220.5 0.29 2.09
And 387.0 598.0 211.0 0.42 2.27 0.009
30-1063 86.0 155.0 69.0 0.56 3.30
(including) 114.2 120.6 6.4 3.19 16.8
And 192.0 301.5 109.5 0.32 2.52 0.019
And 490.5 552.0 61.5 0.33 2.60 0.011
And 634.5 678.0 43.5 0.48 3.20
30-1069 30.0 267.0 237.0 0.32 2.46
(including) 252.0 264.0 12.0 1.46 9.76
And 303.0 342.0 39.0 0.81 6.85
And 374.7 528.5 148.8 0.63 4.40
(including) 442.5 482.2 39.7 1.21 8.18

All drill holes were drilled sub-vertically into the Gaspé Copper altered calcareous stratigraphy that dips 20 to 25 degrees to the north; true widths are estimated at 90-92% of reported widths. The L1 (C Zone) the L2 (E Zone) skarn/marble horizons were intersected in all holes, as well as intervening porcellanites (potassic-altered hornfels) that host the bulk of the disseminated copper mineralization.

Mineralization occurs as disseminations and veinlets of chalcopyrite and is mostly stratigraphically controlled in the area of Needle Mountain, Needle East and Copper Brook. As expected, no significant molybdenum mineralization was encountered in porcellanites in the latter areas, but high grades (up to 0.4% Mo) were locally obtained in both the C Zone and E Zone skarns. The bulk of the molybdenum mineralization occurs in the stockworks further north at Copper Mountain, where true porphyry copper-style stockwork mineralization occurs, forming a distinct secondary mineralized zone that is characterized by widespread, continuous copper-molybdenum mineralization radiating from the central source of hydrothermal fluids, i.e. the Copper Mountain porphyry intrusion. At least five vein/stockwork mineralizing events have been recognized at Copper Mountain, which overprint earlier skarn/porcellanite-hosted mineralization throughout the Gaspé Copper system. The 2022 to 2024 Osisko Metals drill programs were focused on defining open-pit resources within the Copper Mountain stockwork mineralization, leading to the May 2024 MRE (see May 6, 2024 press release ). Extending the resource model south of Copper Mountain into the poorly-drilled primary skarn/porcellanite portion of the system subsequently led to a significantly increased resource, mostly in the Inferred category (see November 14, 2024 press release ).

The 2025 drill program is primarily designed to convert the November 2024 MRE to Measured and Indicated categories, as well as test the expansion of the system deeper into the stratigraphy and laterally to the south and southwest towards Needle East and Needle Mountain respectively.

Qualified Person

Mr. Bernard-Olivier Martel, P. Geo., an independent consultant, is the Qualified Person responsible for the technical data reported in this news release and he is a Professional Geologist registered in the Province of Quebec.

Quality Assurance / Quality Control

Mineralized intervals reported herein are calculated using an average 0.12% copper lower cutoff over contiguous 20-metre intersections (shorter intervals as the case may be at the upper and lower limits of reported intervals).

Osisko Metals adheres to a strict QA/QC program for core handling, sampling, sample transportation and analyses, including insertion of blanks and standards in the sample stream. Drill core is securely transported to its core processing facility on site, where it is logged, cut and sampled. Samples selected for assay are sealed and shipped to ALS Canada Ltd.’s preparation facility in Sudbury. Pulps are analyzed at the ALS Canada Ltd. facility in North Vancouver, BC. All samples are analyzed by four acid digestion followed by both ICP-AES and ICP-MS for copper, molybdenum and silver.

About Osisko Metals

Osisko Metals Incorporated is a Canadian exploration and development company creating value in the critical metals sector, with a focus on copper and zinc. The Company acquired a 100% interest in the past-producing Gaspé Copper mine from Glencore Canada Corporation in July 2023. The Gaspé Copper mine is located near Murdochville in Québec s Gaspé Peninsula. The Company is currently focused on resource expansion of the Gaspé Copper system, with current Indicated Mineral Resources of   824 Mt grading 0.34% CuEq and Inferred Mineral Resources of 670 Mt grading 0.38% CuEq (in compliance with NI 43-101). For more information, see Osisko Metals’ November 14, 2024 news release entitled ‘ Osisko Metals Announces Significant Increase in Mineral Resource at Gaspé Copper ‘. Gaspé Copper hosts the largest undeveloped copper resource in eastern North America, strategically located near existing infrastructure in the mining-friendly province of Québec.

In addition to the Gaspé Copper project, the Company is working with Appian Capital Advisory LLP through the Pine Point Mining Limited joint venture to advance one of Canada s largest past-producing zinc mining camps, the Pine Point project, located in the Northwest Territories. The current mineral resource estimate for the Pine Point project consists of Indicated Mineral Resources of 49.5 Mt at 5.52% ZnEq and Inferred Mineral Resources of 8.3 Mt at 5.64% ZnEq (in compliance with NI 43-101). For more information, see Osisko Metals June 25, 2024 news release entitled ‘Osisko Metals releases Pine Point mineral resource estimate: 49.5 million tonnes of indicated resources at 5.52% ZnEq’ . The Pine Point project is located on the south shore of Great Slave Lake, Northwest Territories, close to infrastructure, with paved road access, an electrical substation and 100 kilometers of viable haul roads.

For further information on this news release, visit www.osiskometals.com or contact:

Don Njegovan, President Email: info@osiskometals.com

Cautionary Statement on Forward-Looking Information

This news release contains ‘forward-looking information’ within the meaning of applicable Canadian securities legislation based on expectations, estimates and projections as at the date of this news release. Any statement that involves predictions, expectations, interpretations, beliefs, plans, projections, objectives, assumptions, future events or performance (often, but not always, using phrases such as ‘expects’, or ‘does not expect’, ‘is expected’, ‘interpreted’, management’s view’, ‘anticipates’ or ‘does not anticipate’, ‘plans’, ‘budget’, ‘scheduled’, ‘forecasts’, ‘estimates’, ‘potential’, ‘feasibility’, ‘believes’ or ‘intends’ or variations of such words and phrases or stating that certain actions, events or results ‘may’ or ‘could’, ‘would’, ‘might’ or ‘will’ be taken, occur or be achieved) are not statements of historical fact and may be forward-looking information and are intended to identify forward-looking information. This news release contains forward-looking information pertaining to, among other things: the tax treatment of the FT Units; the timing of incurring the Qualifying Expenditures and the renunciation of the Qualifying Expenditures; the ability to advance Gaspé Copper to a construction decision (if at all); the ability to increase the Company’s trading liquidity and enhance its capital markets presence; the potential re-rating of the Company; the ability for the Company to unlock the full potential of its assets and achieve success; the ability for the Company to create value for its shareholders; the advancement of the Pine Point project; the anticipated resource expansion of the Gaspé Copper system and Gaspé Copper hosting the largest undeveloped copper resource in eastern North America.

Forward-looking information is not a guarantee of future performance and is based upon a number of estimates and assumptions of management, in light of management’s experience and perception of trends, current conditions and expected developments, as well as other factors that management believes to be relevant and reasonable in the circumstances, including, without limitation, assumptions about: the ability of exploration results, including drilling, to accurately predict mineralization; errors in geological modelling; insufficient data; equity and debt capital markets; future spot prices of copper and zinc; the timing and results of exploration and drilling programs; the accuracy of mineral resource estimates; production costs; political and regulatory stability; the receipt of governmental and third party approvals; licenses and permits being received on favourable terms; sustained labour stability; stability in financial and capital markets; availability of mining equipment and positive relations with local communities and groups. Forward-looking information involves risks, uncertainties and other factors that could cause actual events, results, performance, prospects and opportunities to differ materially from those expressed or implied by such forward-looking information. Factors that could cause actual results to differ materially from such forward-looking information are set out in the Company’s public disclosure record on SEDAR+ (www.sedarplus.ca) under Osisko Metals’ issuer profile. Although the Company believes that the assumptions and factors used in preparing the forward-looking information in this news release are reasonable, undue reliance should not be placed on such information, which only applies as of the date of this news release, and no assurance can be given that such events will occur in the disclosed time frames or at all. The Company disclaims any intention or obligation to update or revise any forward- looking information, whether as a result of new information, future events or otherwise, other than as required by law.

Neither the TSX Venture Exchange nor its Regulation Services Provider (as that term is defined in the policies of the TSX Venture Exchange) accept responsibility for the adequacy or accuracy of this news release. No stock exchange, securities commission or other regulatory authority has approved or disapproved the information contained herein.

A photo accompanying this announcement is available at https://www.globenewswire.com/NewsRoom/AttachmentNg/86f64a14-ab80-44b9-804a-0b997e5fc82e

News Provided by GlobeNewswire via QuoteMedia

This post appeared first on investingnews.com