Archive

April 21, 2025

Browsing

Trading is all about the odds. Trade when the odds are in your favor. Exercise patience and stand aside when the odds are NOT in your favor. Stocks are in a bear market with the vast majority of names (76%) trading below their 200-day SMAs. Clearly, the odds are NOT in our favor for equities and equity ETFs. Traders need to look elsewhere. Today’s report will highlight some non-equity leaders and analyze Bitcoin as it sets up.

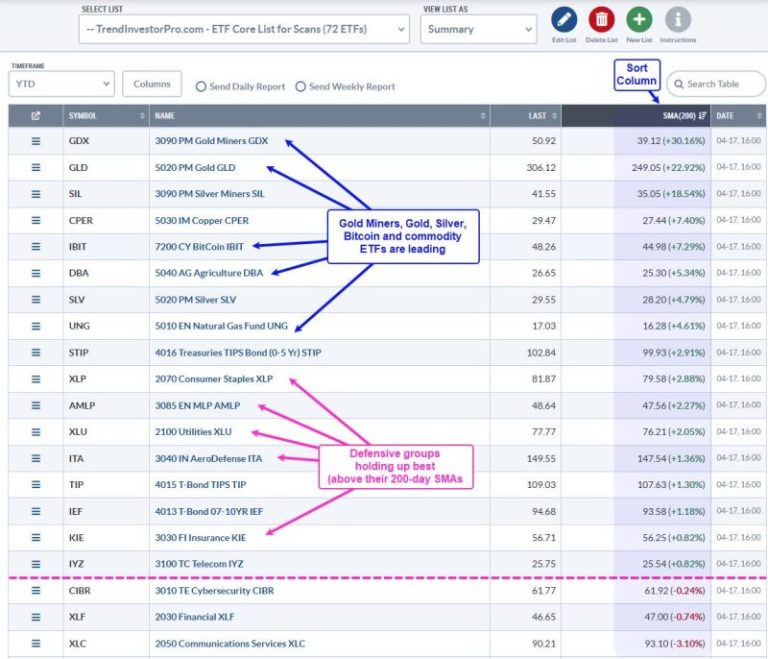
TrendInvestorPro works with a ChartList that has 72 ETFs covering all sectors, the key industry groups, commodities, bonds and crypto. Note that this curated ChartList is available to TrendInvestorPro subscribers. The image below is sorted by the percentage above the 200-day SMA (blue shading) to show the top 20 performers. This simple performance overview reveals a lot. We are NOT in a bull market and alternative assets are attracting attention (gold, Bitcoin).

First, we see leadership from gold, silver, Bitcoin, and commodity-related ETFs. Second, only a handful of equity ETFs are trading above their 200-day SMAs. Third, these ETFs represent defensive groups (Consumer Staples Utilities, MLPs, Aerospace & Defense, Insurance). This is NOT the performance profile for a bull market. We are in a bear market and equities are not the place to be right now.

Improve your odds and stay on the right side of the market with the models and analysis at TrendInvestorPro. Our stock market model turned bearish in mid March, and remains bearish. Even with the big surge on April 9th, our thrust indicators fell well short of a signal because of weak follow through. We will continue to watch these models and focus on equity alternatives. Click here to get a bonus and learn more!  

The Bitcoin ETF (IBIT) is in the leadership group and Bitcoin ($BTCUSD) is bouncing off its 270 day SMA. Where did 270 come from? A typical 200-day SMA covers a little less than 9 months of trading days, which exclude weekends and holidays. Bitcoin trades 24/7, weekends and holidays. Chartists, therefore, need an adjustment to get the ~9-month equivalent for Bitcoin. I chose 270.

The chart below shows Bitcoin ($BTCUSD) with a classic correction and setup in the making. Bitcoin gained over 100% from September to January and was entitled to a correction. Dow Theory teaches us that normal corrections retrace 33 to 67 percent of the prior advance. 50 percent is the base case. The chart shows the Fibonacci retracements with Bitcoin retracing 61.8% as it fell to 75000. Bitcoin also tested the rising 270-day SMA in March and April. A 61.8% retracement and return to the ~9-month SMA are normal for corrections (blue shading).

A falling wedge formed with Bitcoin establishing resistance at 88000 (pink line). Falling wedge patterns are also typical for corrections. More importantly, these patterns provide levels to watch for a trend reversal. Bitcoin is making its first breakout attempt with a move above the upper trendline. Further strength above 88000 would forge a higher high and argue for a new uptrend. I would then set a re-evaluation level at the 270-day SMA. A close below this moving average would suggest a failed breakout.  

TrendInvestorPro keeps you on the right side.

//////////////////////////////////////////////////

MicroStrategy, now known as Strategy, has announced another Bitcoin purchase, which it made between April 14 and April 20. This brings the company’s total Bitcoin holdings to 538,200 BTC. The MSTR Stock price has rebounded amid this latest purchase.

MicroStrategy Purchases 6,556 BTC For $555 Million

In a press release, MicroStrategy announced that it had purchased 6,556 Bitcoins for $555.80 million at an average price of $84,785 per BTC. The company, which is now known as Strategy, has also achieved a BTC yield of 12.1% year-to-date (YTD).

Michael Saylor’s company now holds 538,200 BTC, which it acquired for $36.47 billion at an average price of $67,766 per bitcoin. The firm remains the public company with the largest Bitcoin holdings, well ahead of the rest, including MARA Holdings.

It is worth mentioning that this is MicroStrategy’s second consecutive weekly purchase. As CoinGape reported, the company acquired 3,459 BTC for $285 million two weeks ago.

Meanwhile, Strategy has indicated that it plans to continue purchasing BTC in the foreseeable future through its stock sales. This year, the company has already announced plans to raise over $20 billion to fund its Bitcoin acquisition plans.

The company continues to acquire more BTC despite the flagship crypto’s sideways movement over the last few months. Other institutional investors, like Metaplant, have also shown a commitment to their Bitcoin strategy despite the current market trend.

Metaplanent recently acquired 330 BTC for $28.2 million, bringing its total BTC holdings to 4,855 BTC, which is worth nearly $500 million. Japanese retailer ANAP also acquired $70 million worth of Bitcoin.

MSTR Stock Rebounds Almost 3%

MicroStrategy’s stock has rebounded almost 3% amid news of the company’s latest Bitcoin purchase. Nasdaq data shows that the stock is currently trading at around $325 in pre-market trading, up from its closing price of $317 last Friday.

The MSTR stock price rebound is also likely thanks to the recent Bitcoin price rally, with the leading crypto rallying to as high as $87,500 on Easter Monday. MSTR and BTC share a strong positive price correlation due to Strategy’s massive exposure to Bitcoin.

It is unclear if Bitcoin’s latest move is simply a bull trap or the beginning of a massive uptrend for the leading crypto. Crypto analysts like Kevin Capital have warned that BTC needs to break above $89,000 for confirmation of an uptrend. Until then, he warned market participants to stay measured.

If BTC continues to rally in the short to mid-term, MSTR stock could also maintain a sustained upward trend. Michael Saylor recently highlighted how MicroStrategy has recorded the best returns among the major assets since it adopted a Bitcoin strategy.

The post Michael Saylor’s MicroStrategy Acquires 6,556 Bitcoins For $555M, MSTR Stock Rebounds appeared first on CoinGape.

Former Senatorial candidate and pro-XRP lawyer John Deaton has commented on a recent report that revealed certain crypto firms are looking to apply for bank licenses. Deaton expressed surprise that Ripple wasn’t among these firms, considering the efforts the crypto firm has made so far to disrupt the financial landscape.

John Deaton Comments On Ripple’s Exclusion

In an X post, Deaton stated that he is surprised not to see Ripple on the list of crypto firms looking to apply for bank licenses. The pro-XRP lawyer was reacting to a Wall Street Journal (WSJ) report, which revealed that Coinbase, Circle, BitGo, and Paxos were looking to apply for bank licenses.

Deaton remarked that it was only a matter of time before crypto firms look to compete with traditional financial institutions and become the go-to for banking needs. According to the WSJ report, the top crypto exchange and these other crypto firms plan to apply for bank charters or licenses.

This bank charter would enable these firms to operate as a bank or any other type of financial institution, depending on the agreement between the regulator and these firms on what kind of services they can provide.

Deaton’s surprise likely relates to the fact that Ripple has so far made several efforts to establish itself in the financial space, especially through its payment services. Moreover, the crypto firm recently agreed to acquire prime broker Hidden Road for $1.25 billion, as part of its effort to expand its services.

However, the crypto firm could still make a similar move to apply for a bank license once it ends its ongoing legal battle against the US Securities and Exchange Commission. The court recently granted both parties’ joint motion to pause the XRP lawsuit while they finalize their settlement.

Hidden Road Acquires FINRA Approval

While Ripple may not be looking to apply for a bank license just yet, the crypto firm is still making other moves, especially through its latest acquisition. Hidden Road recently received approval from the Financial Industry Regulatory Authority (FINRA) to operate as a member broker-dealer.

The firm explained that the approval will enable it to expand its recently launched fixed income prime brokerage platform, which includes Fixed Income Repo and Global Funding services. As a broker-dealer, Hidden Road will also be able to provide its clients with several regulatory-compliant prime brokerage, clearing, and financing services in fixed-income assets.

It is worth mentioning that Ripple executive Cassie Craddock recently revealed that the XRP Ledger (XRPL) will begin to power Hidden Road’s post-trade infrastructure as part of the crypto firm’s acquisition of the prime broker.

The post John Deaton Expresses Surprise At Ripple’s Exclusion As Crypto Firms Look To Apply For Bank Licenses appeared first on CoinGape.

After several days of price declined followed by sideways price movement, the crypto market has again turned in bulls’ favor. Like most crypto, Shiba Inu (SHIB) price is also benefiting from it. To be precise, the meme coin’s value pumped by more than 4% in just the last 24 hours. 

Following this promising surge, SHIB’s value is standing at $0.00001258 with a market capitalization of over $7.41 billion, making it the 16th largest crypto. In fact, things can get even better, as an analyst suggested that the chances of SHIB’s price skyrocketing are high—a sign of an upcoming bull run. 

Shiba Inu Price Analysis—A Bull Rally Soon?

As Shiba Inu price gains momentum, several analysts are prediction SHIB’s surge to the moon. One of them is a popular crypto analyst $SHIB KNIGHT. The analyst recently posted a tweet on X mentioning that ill make history again. It is one of the hottest token on the market. The tweet also mentioned that the analyst is waiting for the accumulation phase to end, which will be followed by a massive boom.

However, other datasets revealed not much buying activity was taking place around SHIB. This was evident from the closely knit supply on exchanges and supply outside exchanges charts. 

Source: Santiment

Additionally, after a sharp spike, SHIB’s weighted sentiment also entered the negative zone—a sign of declining bullish sentiment. Hyblock Capital’s data further established the fact that investors were not buying SHIB, one of the top meme coins.

Analysis revealed that SHIB’s sell volume touched 86 in the last few days. For starters, a number closer to 100 means that selling pressure is high. This can negatively affect Shiba Inu price action as it suggested that there are chances of SHIB’s ongoing price uptrend to end soon. 

Source: Hyblock Capital

What Lies Ahead For SHIB

Since there are mixed signals in the market, we then took a closer look at Shiba Inu price chart to better understand whether the meme coin is ready for a bull run. Mentioning Shiba Inu price prediction, in order for the meme coin to sustain its bull rally, it must first go above the $0.00001514 resistance level. A breakout above that will allow SHIB price to reclaim its January 2025 high. 

Source: TradingView

Conclusion

Shiba Inu price analysis shows promising short-term momentum, but mixed market signals suggest caution. A breakout above key resistance could confirm a bull run, making it crucial for investors to closely monitor SHIB’s next moves.

The post Shiba Inu Price Analysis: Could SHIB Start a New Bull Run Soon? appeared first on CoinGape.

Cardano price appears to be inching towards a key breakpoint as it continues to consolidate within a symmetrical triangle pattern visible on its price chart. According to cryptocurrency analyst Ali, this formation could help ADA in a major price movement.

Cardano price predicted to surge 27%

In a recent tweet, Ali suggested that Cardano might be in the early stages of breaking out from this consolidation pattern. The symmetrical triangle visible on the price chart shows converging trendlines that have contained ADA’s price movement since early April 2025.

The symmetrical triangle pattern forming on Cardano’s chart is a period of consolidation where buyers and sellers reach a temporary equilibrium. According to technical analysis principles, symmetrical triangles often serve as continuation patterns, with the breakout direction typically following the prior trend.

In Cardano’s case, the breakout yields the potential 27% price movement mentioned by Ali. The analyst has pointed out that Cardano might be in the early stages of breaking out from this pattern. The analysis by Ali comes as Cardano bulls secure the most important signal to drive a price rally.

Cardano is currently trading at $0.6424 with a 4.3% increase over the past 24 hours. Despite this short-term gain, ADA remains down nearly 10% over the past 30 days.

ADA sentiment remains neutral

Current market sentiment surrounding Cardano is mixed despite the potentially bullish technical setup. According to data from CoinCodex, the overall sentiment toward ADA is currently classified as “Neutral.” However, the Fear & Greed Index shows a reading of 39 and places it in the “Fear” category.

Looking ahead, CoinCodex projects that Cardano’s price could rise by 18.55% to reach $0.765833 by May 21, 2025. While this forecast falls short of the full 27% move suggested by the triangle pattern analysis, it aligns with the general direction and timeframe for a potential upside breakout.

The platform’s analysis of Cardano’s recent performance shows that ADA recorded 14 green days out of the last 30, which is a 47% positive day ratio. Price volatility over this period also stood 7.31%.

Despite the current “Fear” reading and mixed sentiment indicators, CoinCodex concludes that it’s now a good time to buy Cardano based on their technical indicators. However, the next move by ADA could very well be based on the overall market conditions too.

The post Will Cardano Price Break Out Soon? Triangle Pattern Hints at 27% ADA Surge appeared first on CoinGape.

As the crypto market is experiencing a bullish reversal with its total market cap surging by 3.17% to $2.74 trillion, the Solana price is gearing up for a potential rebound. As traders and investors are looking to capitalize on the token’s volatility, analysts unveil key price levels to watch in short term.

Notably, analysts like Ted predict SOL’s potential uptick to $180 amidst increasing whale activity. In this article, we’ll explore the top Solana price levels to watch in the short term which will help you to stay ahead of the curve and capitalize on market opportunities.

Will Solana Price Hit $180 in May?

As the Solana price hovers below $140, analysts and traders are closely watching market movements. While bears fear of a possible crash to $120, analysts like Ted offers a bullish outlook, predicting SOL’s potential surge to $180 by May 2025.

Presenting historical trends, Ted asserts that the Solana price is poised to reach $160-$180. He notes that Solana’s current patterns mirror those seen in 2022 Q4, suggesting potential similarities in future price movements.

In addition, the analyst maintains a bullish outlook for the token, predicting a new all-time high for SOL during the third quarter of this year.

SOL Clears Key Resistance: What’s Next

In his recent X post, TraderAG projected Solana price’s potential target of $170 as it has broken past its key resistance level at $135-$137. Though the analyst expected a retest to the $125 level, SOL broke past the resistance zone, sparking speculations of an uptrend.

According to TraderAG, SOL is capable of reaching $170 and beyond in the near term. CoinGape’s Solana price prediction reveals that SOL is expected to reach a maximum level of $173.44 and a minimum of $140.04 in 2025.

Key Levels To Watch

Analyst Degen Hardy presents a detailed analysis of SOL’s current market conditions where he is trying to identify a long entry opportunity. As per his conclusions, the ideal scenario will be the Solana price to pull back, which, in turn, will form an inverse head and shoulders pattern.

Significantly, the chart presented by the trader represents key levels to watch. As SOL has surged past the significant support level of $125 and the resistance level of $135, the next target is $178.

Source: X, Degen Hardy

As of now, SOL is trading at $139.23, up 2.15%.Over the past week and month, Solana has experienced a surge of 3.25% and 6.6%, respectively. Historical data suggests that Solana price could ultimately reach $256 if it surges past $178. The key levels in between $178 and $256 include $199, $216, and $238.

Moreover, increased whale activity also projects a potential rebound in Solana’s price. Whale Alert revealed that a Binance address moved 374,161 SOL ($52,768,341) to an unknown wallet.

The post Top Solana Price Levels to Watch in the Short Term appeared first on CoinGape.

Nintendo on Friday announced that retail preorder for its Nintendo Switch 2 gaming system will begin on April 24 starting at $449.99.

Preorders for the hotly anticipated console were initially slated for April 9, but Nintendo delayed the date to assess the impact of the far-reaching, aggressive “reciprocal” tariffs that President Donald Trump announced earlier this month.

Most electronics companies, including Nintendo, manufacture their products in Asia. Nintendo’s Switch 1 consoles were made in China and Vietnam, Reuters reported in 2019. Trump has imposed a 145% tariff rate on China and a 10% rate on Vietnam. The latter is down from 46%, after he instituted a 90-day pause to allow for negotiations.

Nintendo said Friday that the Switch 2 will cost $449.99 in the U.S., which is the same price the company first announced on April 2.

“We apologize for the retail pre-order delay, and hope this reduces some of the uncertainty our consumers may be experiencing,” Nintendo said in a statement. “We thank our customers for their patience, and we share their excitement to experience Nintendo Switch 2 starting June 5, 2025.”

The Nintendo Switch 2 and “Mario Kart World bundle will cost $499.99, the digital version “Mario Kart World” will cost $79.99 and the digital version of “Donkey Kong Bananza” will cost $69.99, Nintendo said. All of those prices remain unchanged from the company’s initial announcement.

However, accessories for the Nintendo Switch 2 will “experience price adjustments,” the company said, and other future changes in costs are possible for “any Nintendo product.”

It will cost gamers $10 more to by the dock set, $1 more to buy the controller strap and $5 more to buy most other accessories, for instance.

Retailer Best Buy said Friday that it will also begin accepting preorders for the Nintendo Switch 2 console, games and accessories on April 24.

The company said that for the first time in six years, most of its stores will open at midnight for the official launch day, June 5, so that customers can “get their hands on their new Switch 2 immediately.”

This post appeared first on NBC NEWS

Netflix executives messaged Thursday that all is well with the business in the face of economic turbulence. But its full-year outlook tells a slightly more nuanced story.

Netflix posted a big beat on operating margin for the first quarter, reporting 31.7% compared with the average estimate of 28.5%, according to StreetAccount. And it guided well above analyst estimates for the second quarter — 33.3% against an average estimate of 30%.

By its own phrasing, Netflix was “ahead” of its own guidance for the first quarter and is “tracking above the mid-point of our 2025 revenue guidance range.”

Still, Netflix declined to alter any of its longer-term projections. That suggests Netflix isn’t quite as confident in its second half.

“There’s been no material change to our overall business outlook since our last earnings report,” Netflix wrote in its quarterly note to shareholders.

U.S. consumer sentiment is at its second-lowest level since 1952 as President Donald Trump’s new tariff policies roil markets.

Co-CEO Greg Peters noted during the company’s earnings conference call that Netflix has, in the past, “been generally quite resilient” to economic slowdowns. Home entertainment provides a cheaper form of leisure than most other activities. A monthly Netflix subscription with ads costs $7.99.

But the question remains how — or whether — an economic slowdown would pinch Americans’ wallets and force higher churn among streaming subscriptions.

Netflix stopped reporting quarterly subscriber numbers this quarter, so the company will likely not detail if it sees a customer slowdown later this year beyond reporting its underlying revenue and profit.

First-quarter revenue of $10.5 billion was roughly in line with analyst expectations, while second-quarter guidance of $11 billion is slightly above.

“Retention, that’s stable and strong. We haven’t seen anything significant in plan mix or plan take rate,” said Peters. “Things generally look stable.”

This post appeared first on NBC NEWS