Archive

April 13, 2025

Browsing

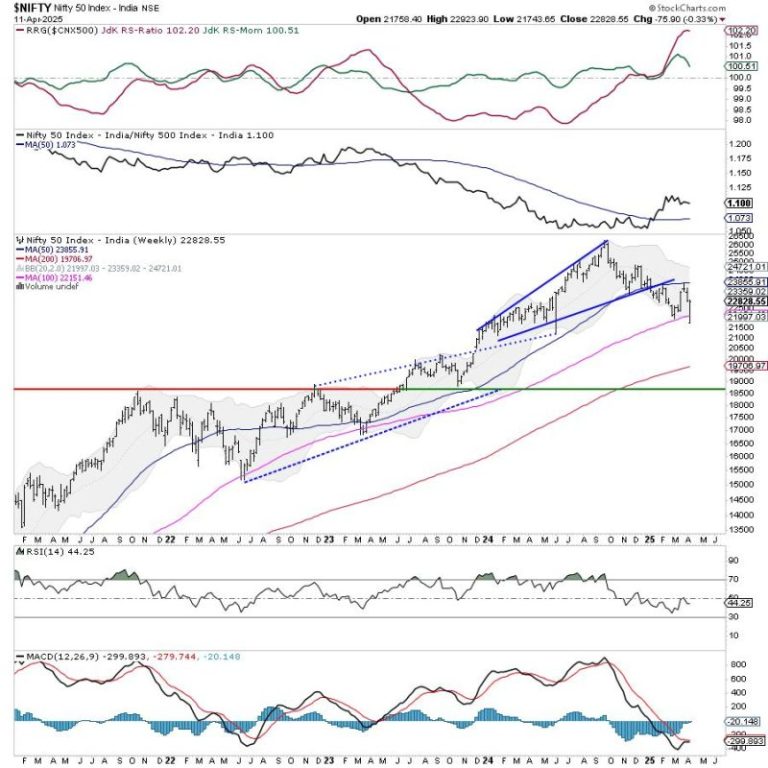
The previous weekly note categorically mentioned that while the markets may continue to decline, the Indian equities are set to outperform its global peers relatively. In line with this analysis, the market saw wide swings owing to prevailing global uncertainties but continued showing remarkable resilience against other global indices. The volatility spiked; the India VIX surged sharply by 46.18% to 20.11 on a weekly basis. The markets witnessed significant volatility, and as a result, the Nifty oscillated in a wide 1180.25 range during the past week. Despite this, the headline index Nifty 50 closed with a negligible loss of just 75.90 points (-0.33%).

The coming week is also short; Monday is a trading holiday for Dr. Babasaheb Ambedkar Jayanti. From a technical perspective, a few of the significant things have happened. Although the Nifty formed a fresh swing low of 21743 while slipping below its previous low of 21964, the Index has successfully defended the important support level of 100-week MA that stands at 22152. This level remains a very important support level for the market in the near term. So long as the Nifty keeps its head above this point, it will stay in a larger range but would avert any major drawdown. A violation of this level will invite structural weakness in the markets. On the upper side, it faces stiff resistance between the 23300-23400 zone, which houses the 20-week MA.

With Monday being a holiday, Tuesday will see the markets opening after a gap of one day and adjusting to the global trade. The levels of 23000 and 23250 may act as potential resistance points; the supports come in much lower at 22400 and 22150.

The weekly RSI is at 44.28; it stays neutral and does not show any divergence against the price. The weekly MACD is bearish and stays below its signal line; however, the narrowing Histogram hints at a likely positive crossover in the coming days.

The pattern analysis of the weekly Nifty chart reflects a strong rebound following a successful test of the 100-week moving average in early March, triggering a sharp 1,700-point rally. However, recent corrective moves driven by tariff-related concerns have led to the formation of a new swing low. Despite this, the Index has managed to hold above the crucial 100-week moving average level of 22,152 on a closing basis, which remains a key support zone. As long as the Nifty sustains above this level, the Index is likely to consolidate rather than witness any significant decline. However, a decisive breach below this average could open the door to a deeper corrective phase, which looks unlikely in the near future.

Overall, the Nifty is expected to encounter resistance around the 23,100 level and above, with volatility likely to remain a dominant feature in the near term. The Index may continue to trade within a broad range, making it prudent to adopt a cautious stance. Investors are advised to limit leveraged positions and prioritize protecting gains at higher levels. For fresh entries, the focus should remain on stocks exhibiting relative strength. Given the prevailing uncertainty, maintaining a conservative approach with modest exposure is recommended for the upcoming week. Risk management and selective participation will be essential to effectively navigate the anticipated market swings.


Sector Analysis for the coming week

In our look at Relative Rotation Graphs®, we compared various sectors against CNX500 (NIFTY 500 Index), which represents over 95% of the free float market cap of all the stocks listed.

Relative Rotation Graphs (RRG) show the Nifty Infrastructure, Metal, Banknifty, Services Sector, Consumption, Commodities, and Financial Services sector Indices inside the leading quadrant. Regardless of the direction the markets adopt, these groups are likely to post relative outperformance against the broader markets.

The Nifty Pharma Index is the only sector index present in the weakening quadrant.

The Nifty Auto Index has rolled inside the lagging quadrant, while the IT Index continues to languish inside the lagging quadrant. Besides this, the Midcap 100, Media, and Realty indices are also inside this quadrant, but they are improving on their relative momentum.

The Nifty FMCG, Energy, and PSE Indices are inside the improving quadrant; they are expected to improve their relative performance against the broader Nifty 500 Index.


Important Note: RRG charts show the relative strength and momentum of a group of stocks. In the above Chart, they show relative performance against NIFTY500 Index (Broader Markets) and should not be used directly as buy or sell signals.  


Milan Vaishnav, CMT, MSTA

Consulting Technical Analyst

www.EquityResearch.asia | www.ChartWizard.ae

In 2024-2025, the United States significantly escalated its trade conflict with China through new tariffs, including a substantial 100% tariff on electric vehicles and 50% on essential technologies like semiconductors and solar products. These measures amplify the existing trade tensions and represent a profound shift towards economic decoupling between the two largest global economies. This article evaluates both short-term and long-term economic impacts of these tariffs, analyzing their implications for global trade patterns and specifically examining India’s potential to capitalize on these shifting dynamics.

Read the full note here

Milan Vaishnav, CMT, MSTA

Consulting Technical Analyst
www.EquityResearch.asia | www.ChartWizard.ae

The memecoin ecosystem has joined the latest revival in the broader market, with the Shiba Inu price now in the spotlight. The memecoin has reset its bearish outlook and will break crucial price milestones in the coming days.

For Shiba Inu, the death cross formation was confirmed on April 6 when the price dropped from $0.00001232 to a low of $0.00001030.

Shiba Inu Price Golden Cross Confirmed

Market data shows that the SHIB price is gradually disappearing from its earlier consolidation trend. At the time of writing, the coin’s price was changing hands for $0.00001249, up by 2.14% in 24 hours. 

SHIB recovered after trading at a low price of $0.00001205 to a daily high of $0.00001265 before settling at the current level. This price boost comes as the SHIB burn rate jumped 1000% in early trading, setting the memecoin on a possible revival path.

SHIB/USDT 4H Chart. Source: TradingView

The SHIB/USDT 4h chart confirms a golden cross pattern for the memecoin. This pattern is formed when the short-term Moving Average switches above the longer-term moving average.

Although this pattern is fully formed on the 4-hour chart, it is yet to form on the daily chart. However, with the current momentum, a confirmed breakout is possible. Already, the token has displaced Hedera and now ranks as the 17th largest cryptocurrency.

Shibarium Catalyst for Price Rebound

Different ecosystem factors can boost the price of Shiba Inu in the long term. One of these factors is closely tied to the outlook of Shibarium and its associated Layer-2 scaling solution.

As reported earlier by CoinGape, the Shibarium 200 million addresses milestone is near. If the network attains this landmark, it will show a clear sign of growing adoption, a move that might boost its token valuation.

Already, Shibarium has broken the 1 billion total transaction milestone. Should the Shiba Inu network continue to record organic growth, its chances of outranking Dogecoin is higher.

Amid the ongoing boost, the question remains how high the memecoin could soar. Drawing on this, a potential SHIB retest of its ATH of $0.00008844 is possible moving forward. While it will require as much as a 710% growth from current levels, SHIB can print this uptick, drawing on its historical trend.

The post Shiba Inu Price on The Verge of Breaking $0.00002 As Gold Cross Emerge appeared first on CoinGape.

Avalanche (AVAX) is carving a niche as a blockchain network with boundless scalability but one expert is highlighting its real-world use case in finance. Crypto expert Olivia Vande Woude says Avalanche will change the landscape for traditional finance as we know it.

Avalanche Will Modernize Legacy RTGS Systems

According to an X post, business development expert Olivia Vande Woude remarks that Avalanche will improve current offerings for mainstream finance. Right out the bat, Woude notes that the lowest hanging fruit for AVAX will be changing outdated rails in legacy finance.

Woude argues that rather than a wholesale replacement, an Avalanche integration will improve legacy RTGS systems like SWIFT and Fedwire. Perhaps, the biggest area of improvement will be in conventional post-trade infrastructure bogged down by fragmented reconciliation. Woude notes that the network can introduce real-time finality and liquidity efficiency for post-trade infrastructure.

Large exchange infrastructure is tipped to record seismic changes following an Avalanche integration, says Woude. While CBOE and ICE grapple with execution latency, Woud was Avalanche’s decentralization can reduce slippage for legacy exchanges.

“Avalanche does for finance what fiber optics did for telecom,” said Woude. “It’s replacing outdated rails with real-time, high-throughput, low-latency execution.”

Woude points out in her statement that Avalanche’s tamper-proof infrastructure will improve the batch processing systems employed by traditional custodians. The derivatives markets will receive their fair share of changes, leaning on Avalanche’s collateral optimization and margin logic based on advanced smart contracts.

Amid soaring regulatory changes in the US, traditional financial institutions can unlock new revenue streams in tokenization via blockchain-based integrations.

Benefits Extend To Funding Markets Amid Soaring AVAX Price

Woude highlights the benefits of an integration in short-term funding markets by leaning on its dynamic discounting. Furthermore, the blockchain offers programmable yield analytics designed to revolutionize the operations of repo settlements and liquidity management in funding markets.

An EVM compatibility will allow institutions to still deploy Ethereum-based smart contracts, smoothening the curve for tokenized funds. As the US SEC approves options trading for Ethereum spot ETFs, Avalanche can offer financial institutions permission chains for compliance while offering on-chain derivatives mirroring ETF performance.

“Avalanche isn’t just modernizing financial infrastructure, it’s reprogramming it,” said Woude. “Institutions adopting Avalanche in turn gain a meaningful edge in speed, efficiency, and transparency.”

AVAX price has gained nearly 8% over the last day driven by a broader crypto market rebound and rising institutional adoption for Avalanche. AVAX is trading at $20 while daily trading volumes have spiked by 7% buoyed by bullish chatter around the network.

The post Expert Outlines Reasons Why Avalanche Will Revolutionize Traditional Finance appeared first on CoinGape.

The US crypto market seems poised for bullish trends after Senate Banking Chair Tim Scott stated that most of the pending crypto bills will be passed by August 2025. As this deadline fast approaches, crypto traders are looking for the best altcoins to buy to make significant gains once demand for digital assets rises. 

The recent remarks by Senator Scott coincide with a notable recovery across the crypto market today, April 13. At press time, Bitcoin and all the top ten altcoins were edging higher as the total crypto marketcap reached $2.79 trillion. 

This rally may extend in the coming months as the US emerges as a leading crypto hub. According to Senator Scott, the pending crypto bills will ensure that the US dominates the digital asset space. 

The statement also comes after US President Trump signed the first crypto-related bill. The bill, which was signed earlier this week, seeks to remove tax reporting requirements in the DeFi industry. 

Top Altcoins to Buy Before August 

With the US emerging as one of the most pro-crypto countries, the top altcoins to buy today for investors to make significant gains are Ripple (XRP), Solana (SOL), and Pi Network (PI). 

Ripple (XRP) 

XRP is one of the top altcoins to buy today. One of the reasons that makes Ripple a good buy is that it is the largest US-made altcoin by market cap. Therefore, as the US crypto regulatpry framework changes, XRP is well-positioned to benefit. 

The four-hour XRP price chart suggests the altcoin is in an uptrend. The RSI has risen to 63 showing a prevalence of buying pressure. Meanwhile, the MACD line and green histogram bars support the bullish thesis. 

If the uptrend continues, XRP price may flip resistance at $2.23. Doing so will trigger a 17% rally to the 161.8% Fibonacci level of $2.61. If Ripple reaches This level, it might pave the way for more gains to new highs above $3. 

XRP/USDT: 4-Hour Chart

Solana (SOL)

Solana also ranks among the best altcoins to buy today. SOL trades at $132 today. April 13 after a 10% increase in 24 hours. Analyst Momin has shared a bullish Solana price prediction saying the altcoin might rally to $180 in the coming weeks. 

The analyst also added that Solana is on the verge of making a decisive close above $120 on the weekly chart. If this happens, it will spark a Solana price rally towards $180. Additionally, Solana price has breached the upper trendline of a descending trendline, showing that the bullish momentum is strong, which may spark a surge to $257. 

Solana Price Chart

Pi Network (PI)

Pi Network price had posted a 15% gain at press time. Data from CoinMarketCap also shows that trading volumes have increased by 200% to over $663 million as buyers purchased the asset. 

One of the reasons why Pi Coin is one of the best altcoins to buy ahead of the crypto bills being passed is the asset’s rising presence in the US. The altcoin will be adopted as a means of payment by firms like Zito Realty. At the same time, Chainlink has added Pi Network token to its Data Streams, making it more accessible. 

Pi Coin is trading within an ascending triangle pattern on the four-hour price chart, which shows a positive outlook. At the same time, the AO histogram bars and the RSI are tipping north, which supports a bullish Pi Network price forecast.

PI/USDT: 4-Hour Chart

Summary of Top Altcoins to Buy 

The US will pass most of the pending crypto bills before August according to the Senate Banking Chair Tim Scott. Once these bills are passed, the crypto market is poised to make significant gains. The top altcoins to buy today to position yourself for these gains are XRP, SOL and Pi Coin. 

The post 3 Altcoins to Buy as US Senate Banking Chair Gives August Deadline For Major Crypto Bills appeared first on CoinGape.

Crypto Highlights This Week: Bitcoin and other major tokens have finally rebounded after a massive bloodbath witnessed over the past week. BTC price recovered and gained a hold above $84K following a crash to as low as $74K in the past 7 days.

Simultaneously, other tokens like ETH, Solana, and XRP also illustrated a price rebound, keeping investors slightly hopeful about future movements amid macro uncertainty. Following immense macro heat fueled by Donald Trump’s tariffs saga, risk assets have recovered amid a halt on newly imposed tariffs and other developments.

Mentioned below are some of the top crypto market updates reported by CoinGape Media over the past week.

Weekly Crypto Highlights: BTC & Altcoins Recover

As of press time, BTC price exchanged hands considerably above $84K, up by nearly 1.5% in the past seven days. Further, ETH, SOL, and XRP prices gained roughly 2%-7% over the week. This recovery-like movement comes against the backdrop of a stockpile of optimistic developments.

Notably, macro pressure on risk assets like crypto lessened slightly as the U.S. CPI came in cooler than Wall Street expectations this week. US CPI cooled to 2.4% in March, offering the crypto market some relief after turmoil caused by Trump’s Tariff policy.

On the other hand, Donald Trump recently announced that tech products will be exempted from China tariffs. While an already ongoing halt on the newly imposed tariffs has offered the market some relief, this news has further garnered investor curiosity, lessening trade war tensions.

However, BlackRock CEO Larry Fink rattled the broader market recently by warning of a looming U.S. recession soon. Given this happens, cryptocurrencies could leverage substantially as the U.S. Federal Reserve will move to inject more liquidity in order to stimulate the economy.

Other Major Highlights This Week

Additionally, whale activity across the broader crypto market soared remarkably in the past seven days, signaling renewed market interest amid price recovery. CoinGape reported that Ripple whales moved a staggering $414 million worth of XRP over the past week, sparking investor speculations.

Simultaneously, Dogecoin whales were also recorded to have accumulated 1.83 billion DOGE coins over the past week. The massive buying by Dogecoin whales falls in line with 21Shares’ recent filing for a Dogecoin ETF, echoing market optimism.

Another buzz-worthy update over the week includes Japan introducing new crypto regulations, underscoring support for the sector. Mentioned above were the top crypto highlights for this week, which appeared to have considerably impacted investor sentiment globally.

The post Crypto Highlights This Week: BTC & Altcoins Rebound After Bloodbath, What’s Happening? appeared first on CoinGape.

With Bitcoin (BTC) swiftly reclaiming $80K, the outlook for crypto markets has improved, with many expecting altcoins to rally. Among memecoins, can Dogecoin (DOGE) lead or will Shiba Inu (SHIB) price take the initiative?

Bitcoin’s $80K Move Improves Odds for DOGE & Shiba Inu Price Rally

With Bitcoin finally showing bullish signs, the outlook remains optimistic. In such a case, Shiba Inu price has the upper hand, as seen in the past few days. Comparing returns shows that in 2025 on TradingView, SHIB price is down -42% while DOGE price is down -48%, showing that the selling pressure from Shiba Inu holders is not much.

If Bitcoin’s trend remains bullish and holds its ground above $80K, BTC could easily revisit $100K before April ends. In such a case, Shiba Inu looks more primed to rally and lead.

Shiba Inu Price vs. Dogecoin Price Performance

Between Dogecoin and Shiba Inu, investors are much more interested and committed to SHIB compared to DOGE. Moreover, Elon Musk’s involvement with the former hampered the popularity and the first meme coin has not been the same since.

Shiba Inu, on the other hand, was designed and marketed as a Dogecoin-killer, which is what caused exorbitant rallies in the initial days. Hence, chances of SHIB outperforming the original dog-based meme coin are higher.

Dogecoin & Shiba Inu Price Analysis

Dogecoin price shows that it is currently bouncing off the $0.139 to $0.150 support levels. These barriers were critical resistance levels in mid-2024, but a breakout above this led to a 250% rally in the next 50 days. Hence, holding these levels is key for DOGE bulls for bullish reversals and restarting the uptrend.

A breakout above $0.196 will signal a flip of the market structure, favoring bulls. In such a case, Dogecoin price prediction hints at a 60% rally to $0.313. However, if the buying pressure is strong, DOGE could revisit $0.484 after a 110% climb.

DOGE/USDT 1-Day Chart

A quick look at the Shiba Inu price action shows that it has breached the declining trendlines that serve as resistance. Now, SHIB needs to overcome the $0.00001364 hurdle and flip it into a support floor to confirm the start of a bull run.

In such a case, this Shiba Inu price forecast suggests that the meme coin could explode 108% to $0.00002868.

SHIB/USDT 1-Day Chart


Considering that Shiba Inu is a Dogecoin-killer, it is more likely that the new meme coin will skyrocket and lead the meme coin pack. DOGE will have to follow SHIB’s footsteps.

The post Shiba Inu or Dogecoin: Which Memecoin Explodes First If Bitcoin Price Hits $100K Before April? appeared first on CoinGape.